Defining Smallholder Farmers
Smallholder Farmers or Small-Scale Producers, are frequently mentioned as targets for development interventions, to relieve hunger, alleviate poverty, or catalyze agricultural transformation. However, an operationalizable definition of a smallholder farmer is difficult to come by, with few sources even defining the term. When sources do offer a definition, they rarely agree on the indicators and thresholds to use. This blog post (forthcoming) from EPAR documents a recent literature review highlighting the lack of a clear definition. Below the visualization is further information about the data used to construct the visualization, and a link to the underlying data files. These visualizations are tools developed by EPAR to attempt to provide a clear and consistent answer to the question: "Who is a smallholder farmer?"
The Data
The visualization above is created using nationally representative data from the World Bank’s Living Standards Measurement Study – Integrated Surveys on Agriculture (LSMS-ISA). This is a publicly available household panel survey dataset for seven countries in Sub-Saharan Africa. The survey includes linked agricultural, livestock, household, and community level modules that provide information on a variety of topics including crops, farming practices, livestock, income sources, and socio-demographics.
Specifically, it displays cleaned data from the Nigeria General Household Survey, the Ethiopian Rural Socioeconomic Survey, and the Tanzania National Panel Survey. Each of these surveys represent panel data gathered in waves from the same households. In Ethiopia, the first wave was gathered in 2011-2012, the second wave was gathered in 2013-2014, the third wave was gathered in 2015-2016. In Tanzania the first wave was gathered in 2008-2009, the second wave was gathered in 2010-2011, and the third wave was gathered in 2012-2013. Tanzania also has a fourth wave gathered in 2014-2015, but using a new set of households. In Nigeria, the first wave was gathered in 2010-2011, the second wave was gathered in 2012-2013, and the third wave was gathered in 2015-2016. When only one year is shown, it is the most recent wave.
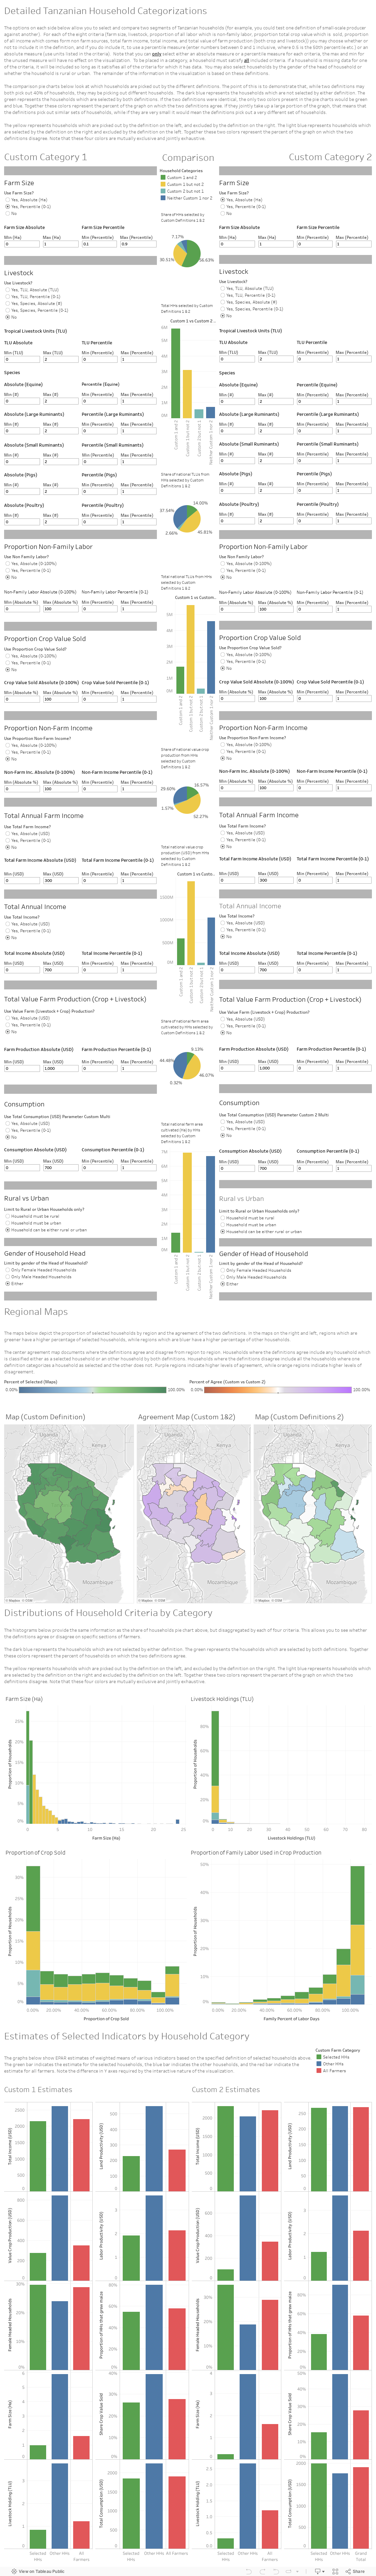
The visualization above is created using nationally reprsentative data from the World Bank’s Living Standards Measurement Study – Integrated Surveys on Agriculture (LSMS-ISA). This is a publicly available household panel survey dataset for seven countries in Sub-Saharan Africa. The survey includes linked agricultural, livestock, household, and community level modules that provide information on a variety of topics including crops, farming practices, livestock, income sources, and socio-demographics. Specifically it displays cleaned data from one panel of the Tanzania National Panel Survey (Year 4, 2014-2015). The code used to generate the variables and estimates is available in a public GitHub repository. The estimates as well as more information about the specific construction decisions for each indicator are available through EPAR's agricultural database. This visualization allows users to look at one particular custom definition in greater depth. This visualization looks at the AGRA definitions in greater depth. To view the visualization in full screen click here.
By Terry Fletcher
Summarizing research by Didier Alia, Terry Fletcher, Pierre Biscaye, C. Leigh Anderson, and Travis Reynolds