Skip to content

Simultaneous Occurrence of 1000+ Acre Fires in US Regions comparing 1984-2001 and 2002-2019

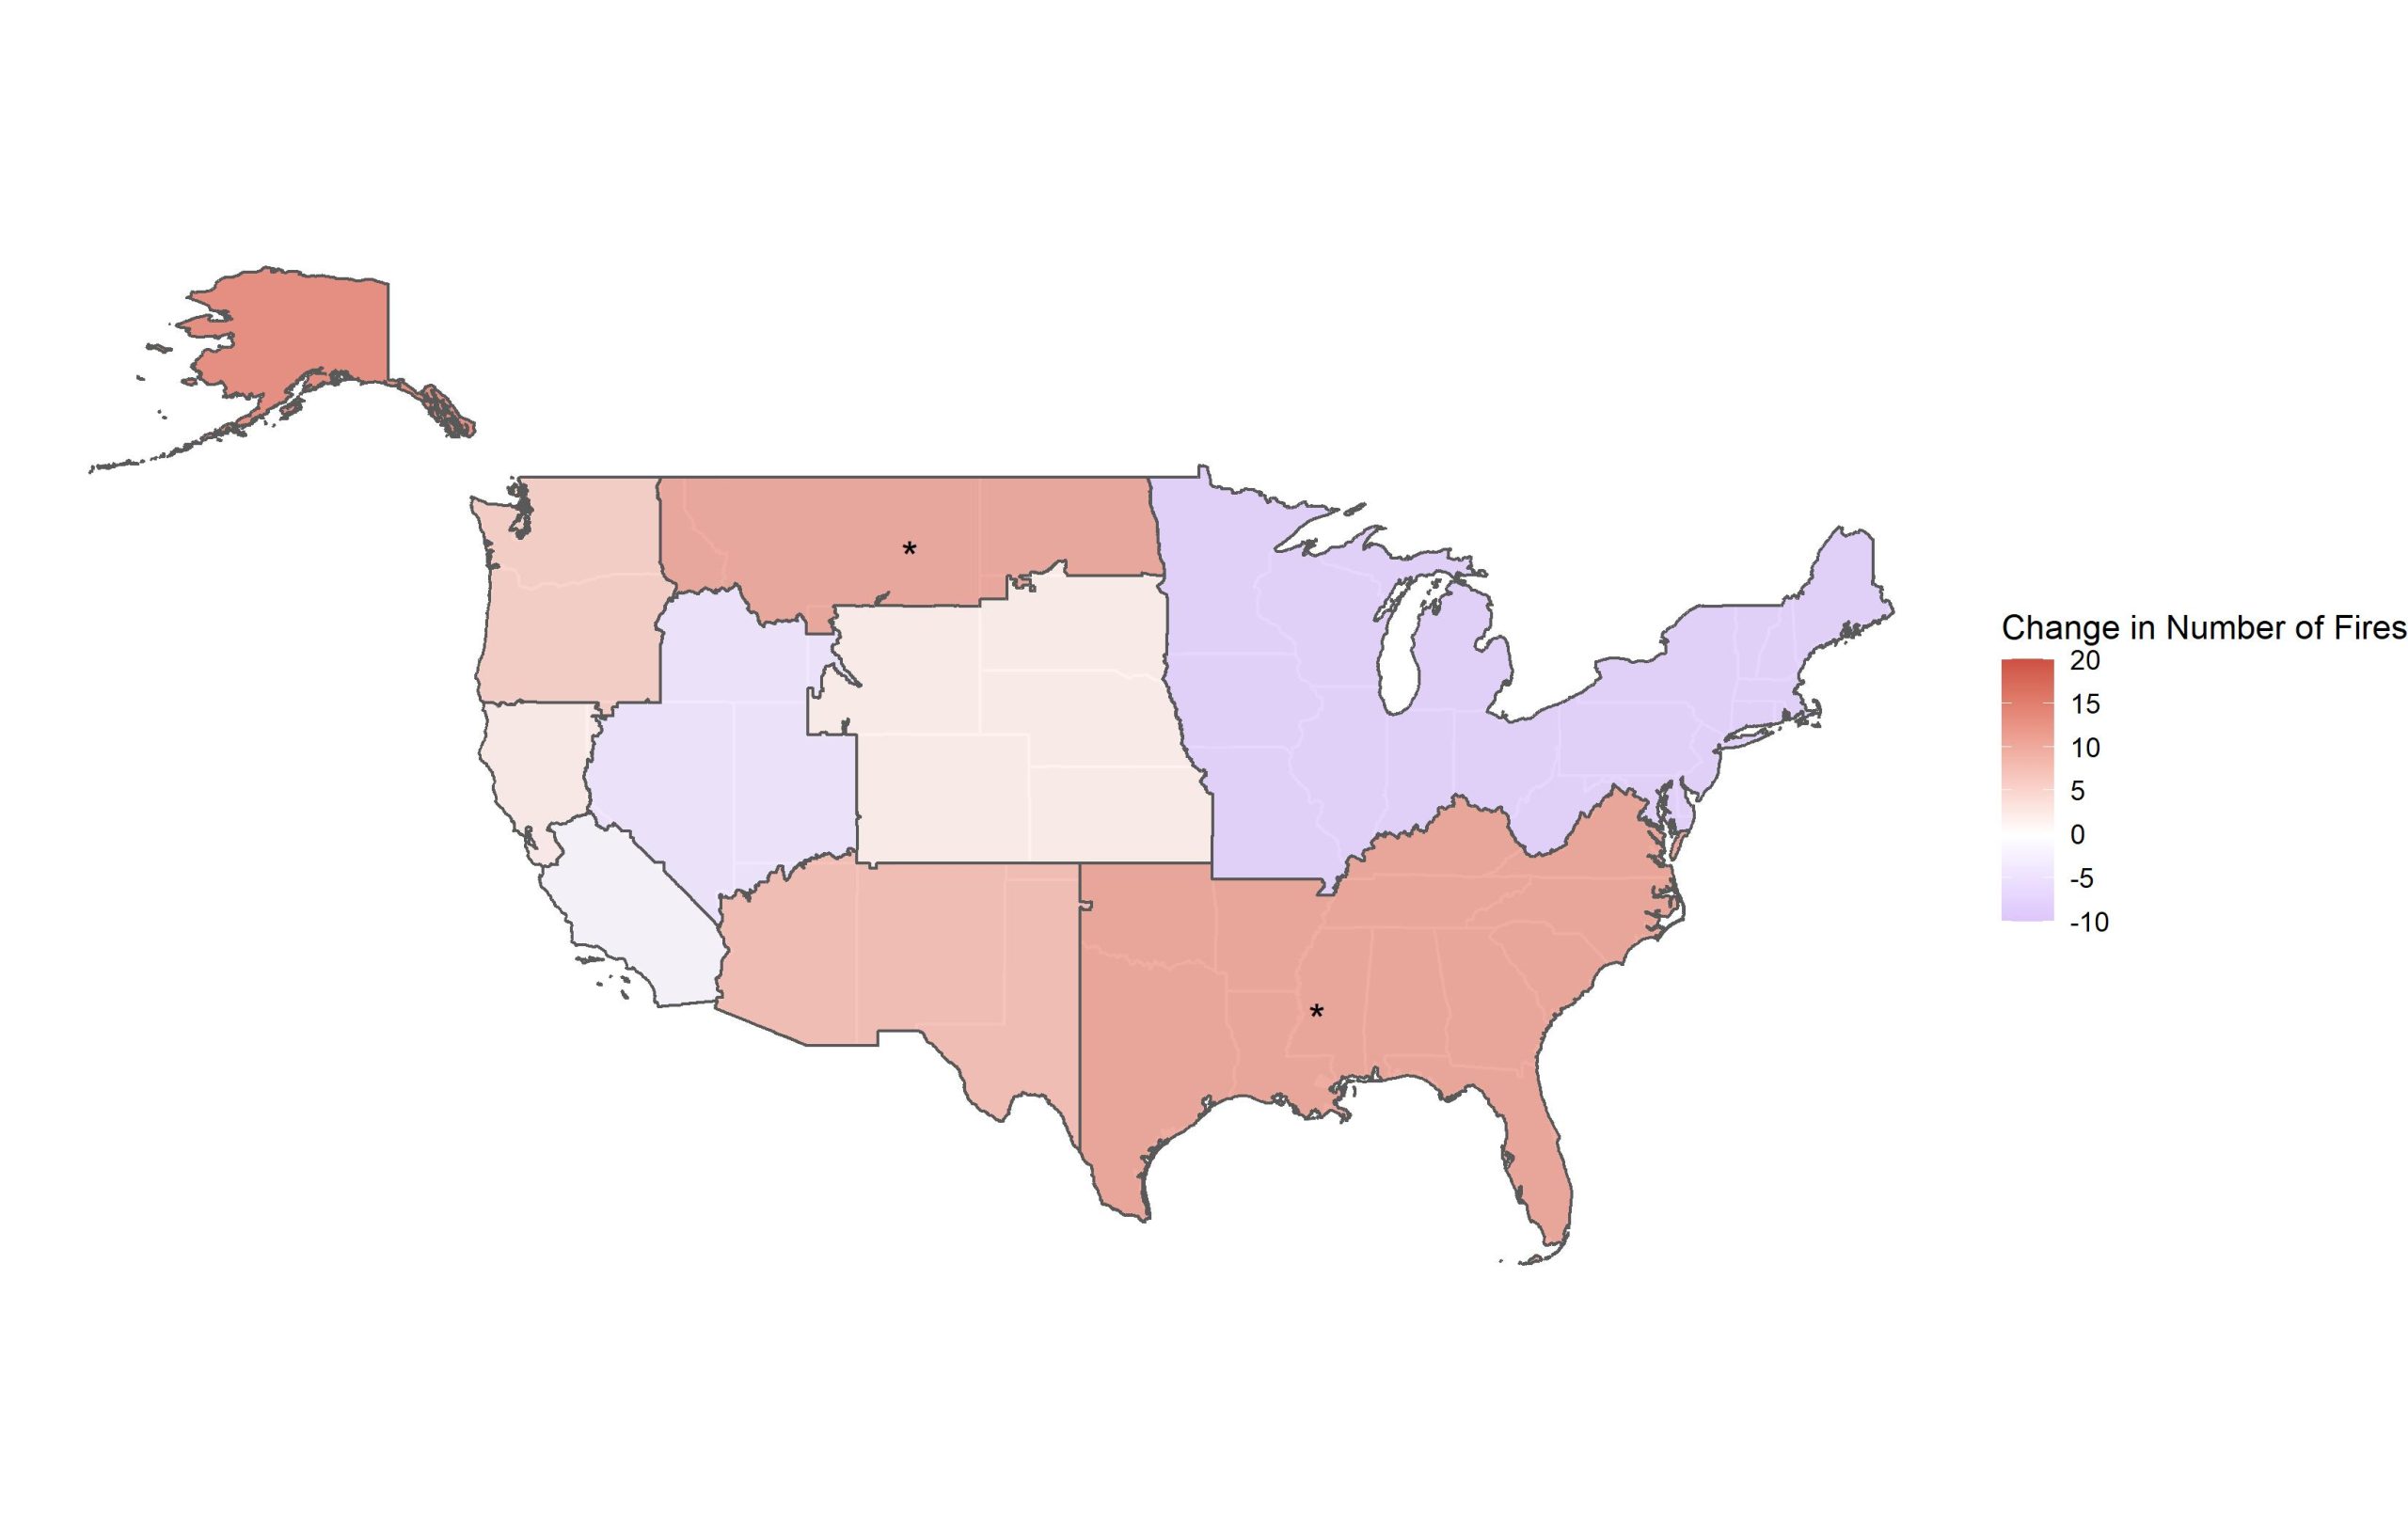
All Large Fires (1000+ acre)

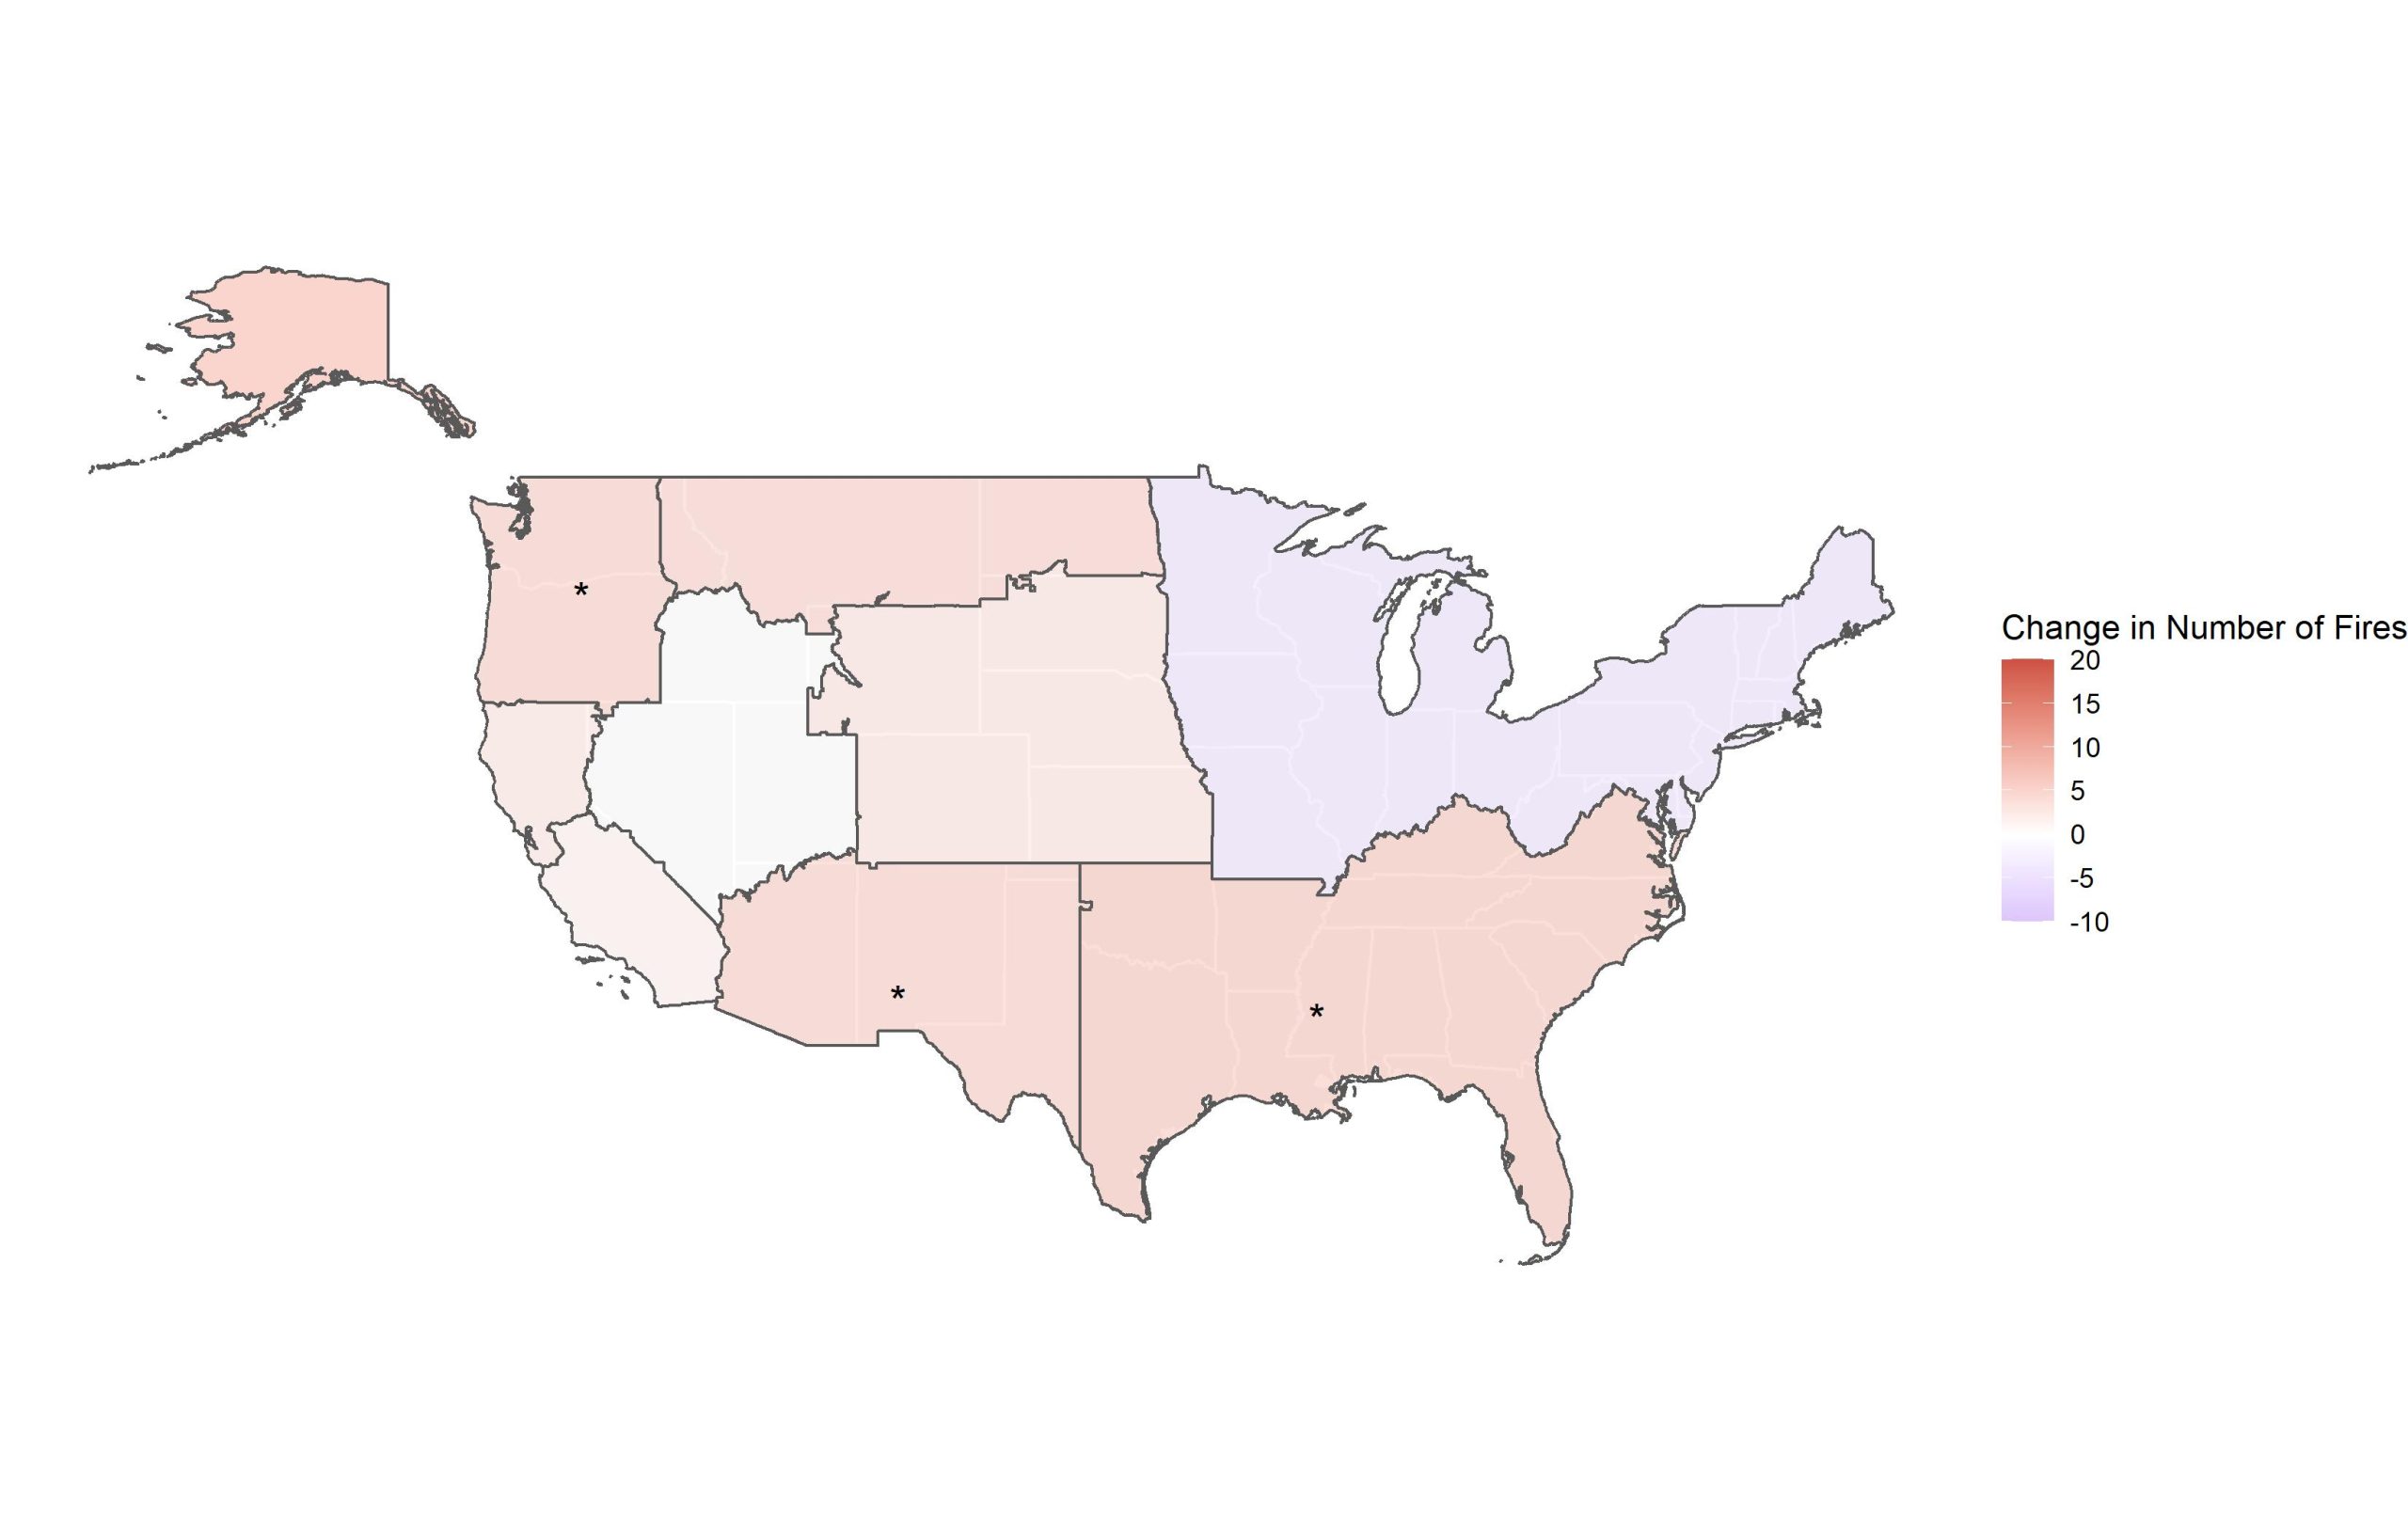
Very Large Fires (75th Percentile or greater)

Change in simultaneous occurrence of 1000+ Acre and 75th Percentile fires, comparing 1984-2001 to 2002-2019. Both maps are divided into regions, with each region representing one GACC. The left panel corresponds to all large fires (ALF, 1000+ acres) while the right panel corresponds to 75th percentile fires (VLF), as determined for each GACC. The shading of each region indicates the change in number of ALF or VLF, respectively, between the two time periods. Red represents an increased number of fires, while blue represents a decreased number of fires. More large fires (1000 acres or greater) occurred during the peak month of simultaneity in the more recent time period, i.e., in 2002-2019 relative to 1984-2001. Statistical significance of the change in number of fires is denoted with asterisks, (*) corresponds to p < 0.05, (**) corresponds to p < 0.01 and (***) correspond to p < 0.001.  Data on simultaneous wildfire occurrence come from the Monitoring Trends and Burn Severity (MTBS) project. Approach is based on Podschwit & Cullen (2020) https://doi.org/10.1071/WF19150. This visualization was made as part of NSF Growing Convergence Project 2019762. 

Month of Peak Wildfire Simultaneity in US Regions
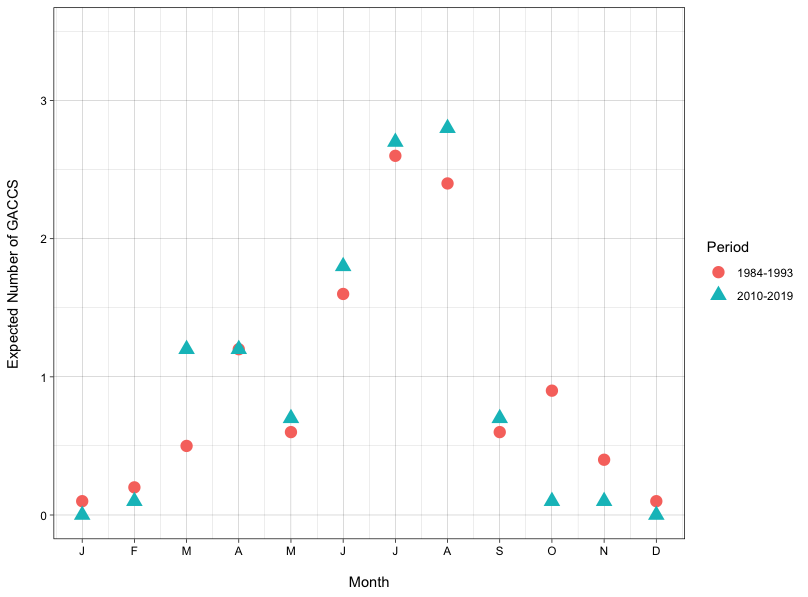
Expected number of Geographic Area Coordination Centers (GACCs) with peak simultaneity during the same calendar month, for all large fires (1,000+ acres). Peak simultaneity is the month of the calendar year with the greatest number of simultaneous fires occurring in a particular region. Orange circles represent data points during the period 1984-1993 while blue triangles represent the points during the period 2010-2019. We observe that more GACCS are expected to experience peak simultaneity in the summer during the more recent time period, and almost no GACC is expected to experience peak simultaneity in the winter during the more recent time period. Data on simultaneous wildfire occurrence come from the Monitoring Trends and Burn Severity (MTBS) project. Approach is based on Podschwit & Cullen (2020) https://doi.org/10.1071/WF19150. This visualization was made as part of NSF Growing Convergence Project 2019762.

Wildfire Simultaneity – Correlation Between US Regions
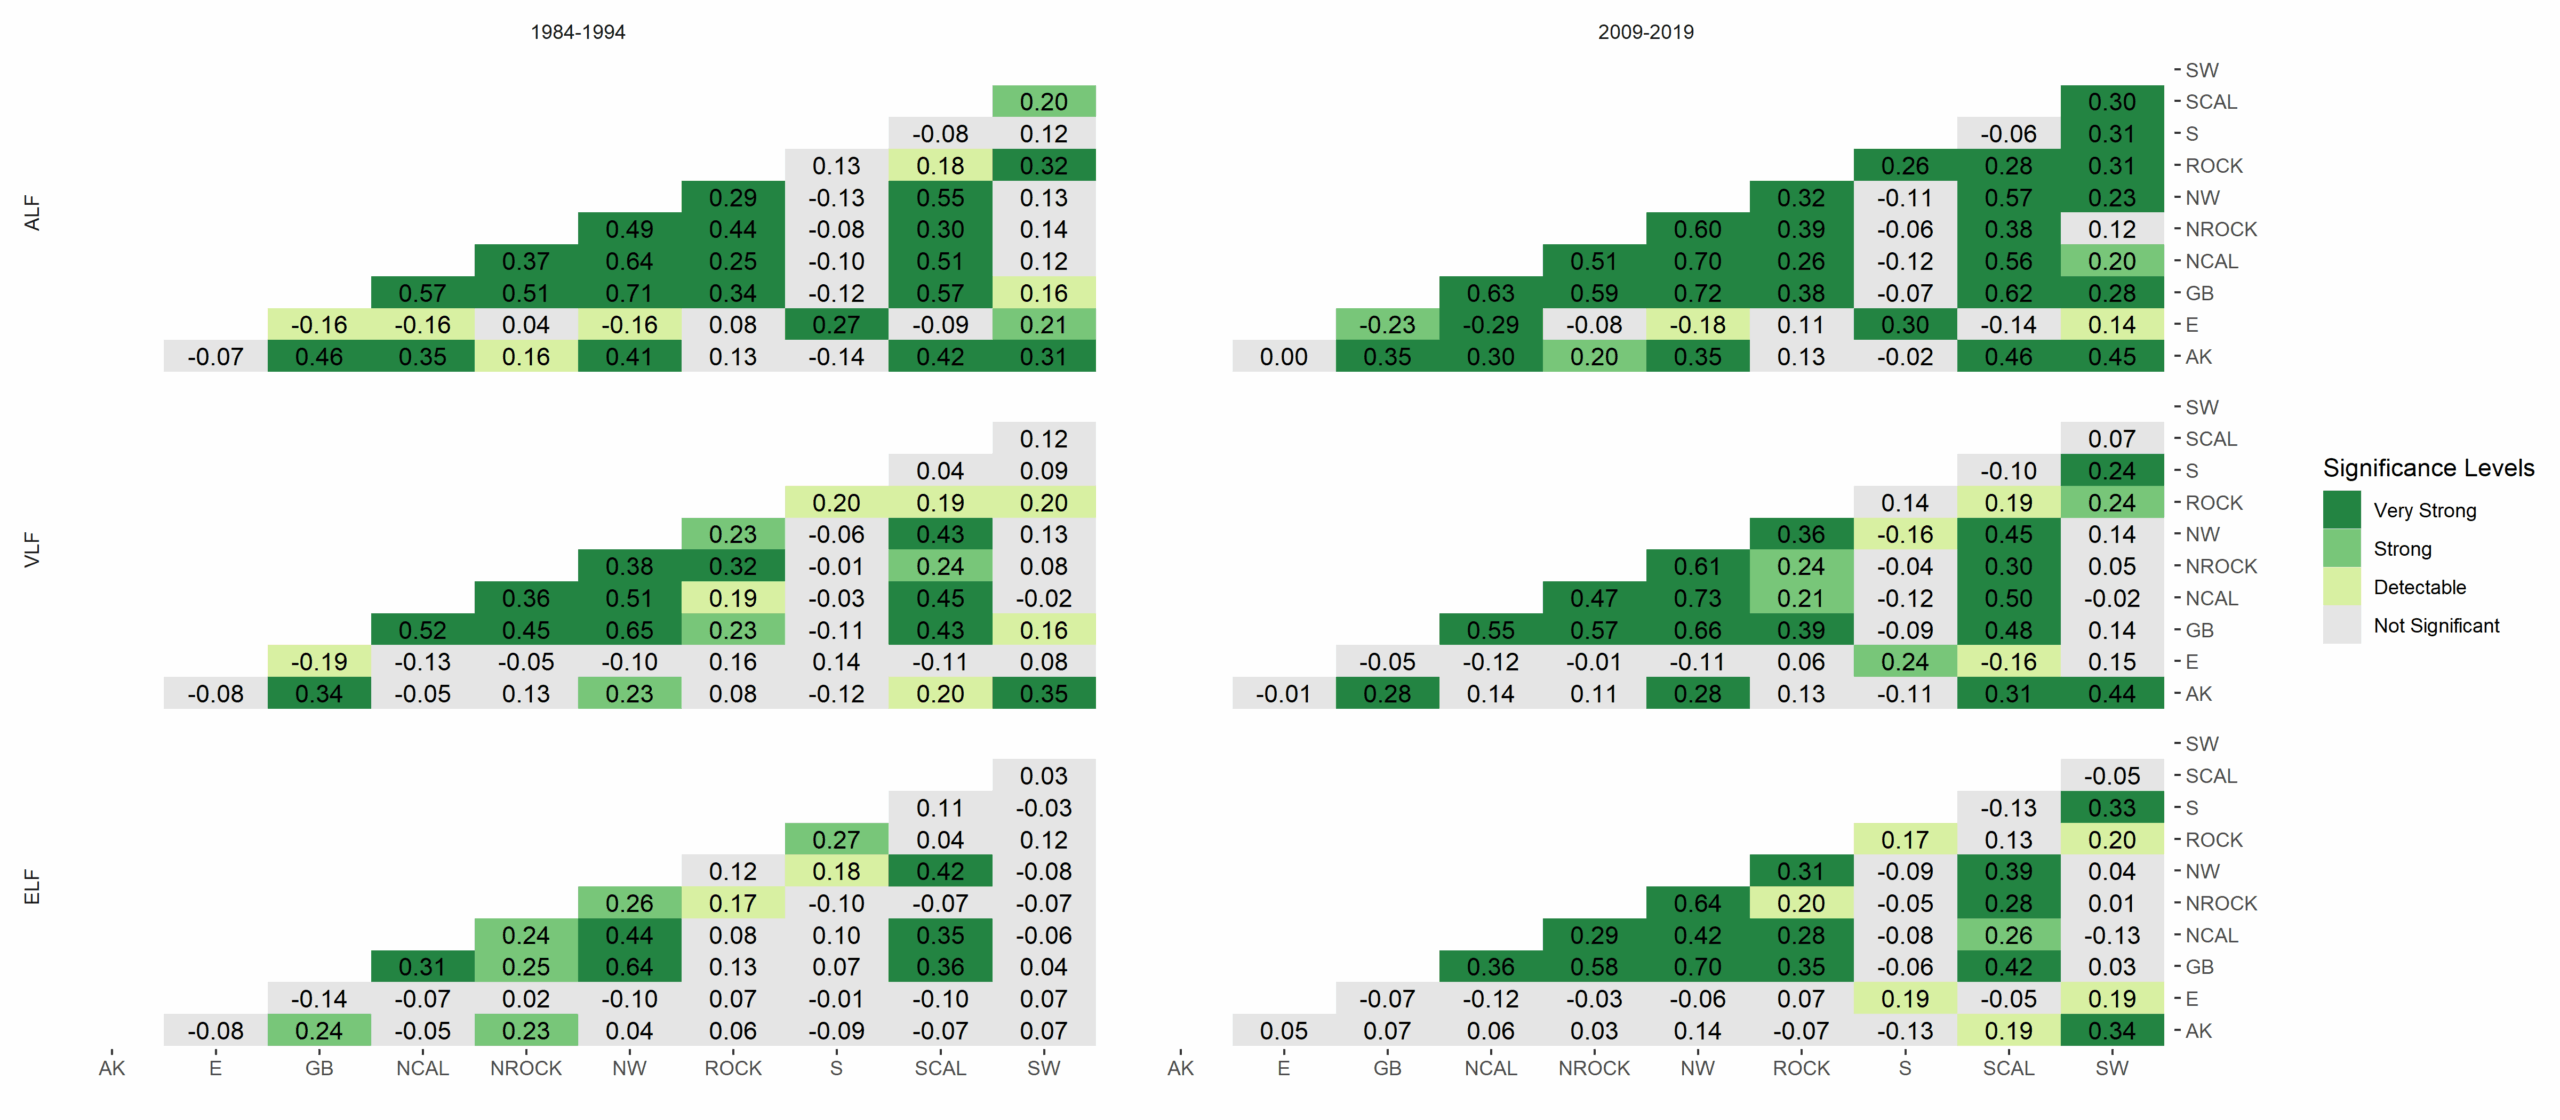
Correlation of fire simultaneity and its statistical significance between Geographic Area Coordination Centers (GACCs) in the US as measured using the Kendall correlation coefficient. Simultaneity is defined as the number of fires co-occuring in each pair of GACCs in a given month. Fires of a given size that occur in the same month in different GACCs are considered simultaneous fires in those GACCs. Each row corresponds to a fire size designation: 1000+ acres (all large fires, or ALF), 75th percentile (very large fires, or VLF) and 90th percentile (extremely large fires, or ELF). Percentiles are determined by the historic record within each GACC. The values reported in the table represent the correlation between the regions identified in the row and column labels and the color identifies the statistical significance level (i.e. spatial autocorrelation). P-values smaller than 0.05 are interpreted as significant or detectable (light green), p-values smaller than 0.01 are interpreted as strongly significant (green), and p-values smaller than 0.001 are interpreted as very strongly significant (dark green). Note that a positive correlation does not necessarily imply two GACCs experiencing many simultaneous fires, as it could also indicate two GACCs simultaneously not experiencing fire. This figure compares correlation across two decades (1984-1994 and 2009-2019), which reflects a general increase in magnitude and significance over time. Data on simultaneous wildfire occurrence come from the Monitoring Trends and Burn Severity (MTBS) project. The approach is based on Podschwit & Cullen (2020) https://doi.org/10.1071/WF19150. This visualization was made as part of NSF Growing Convergence Project 2019762.

2040-2070 Median Annual Days Above Historical 97th Percentile ERC
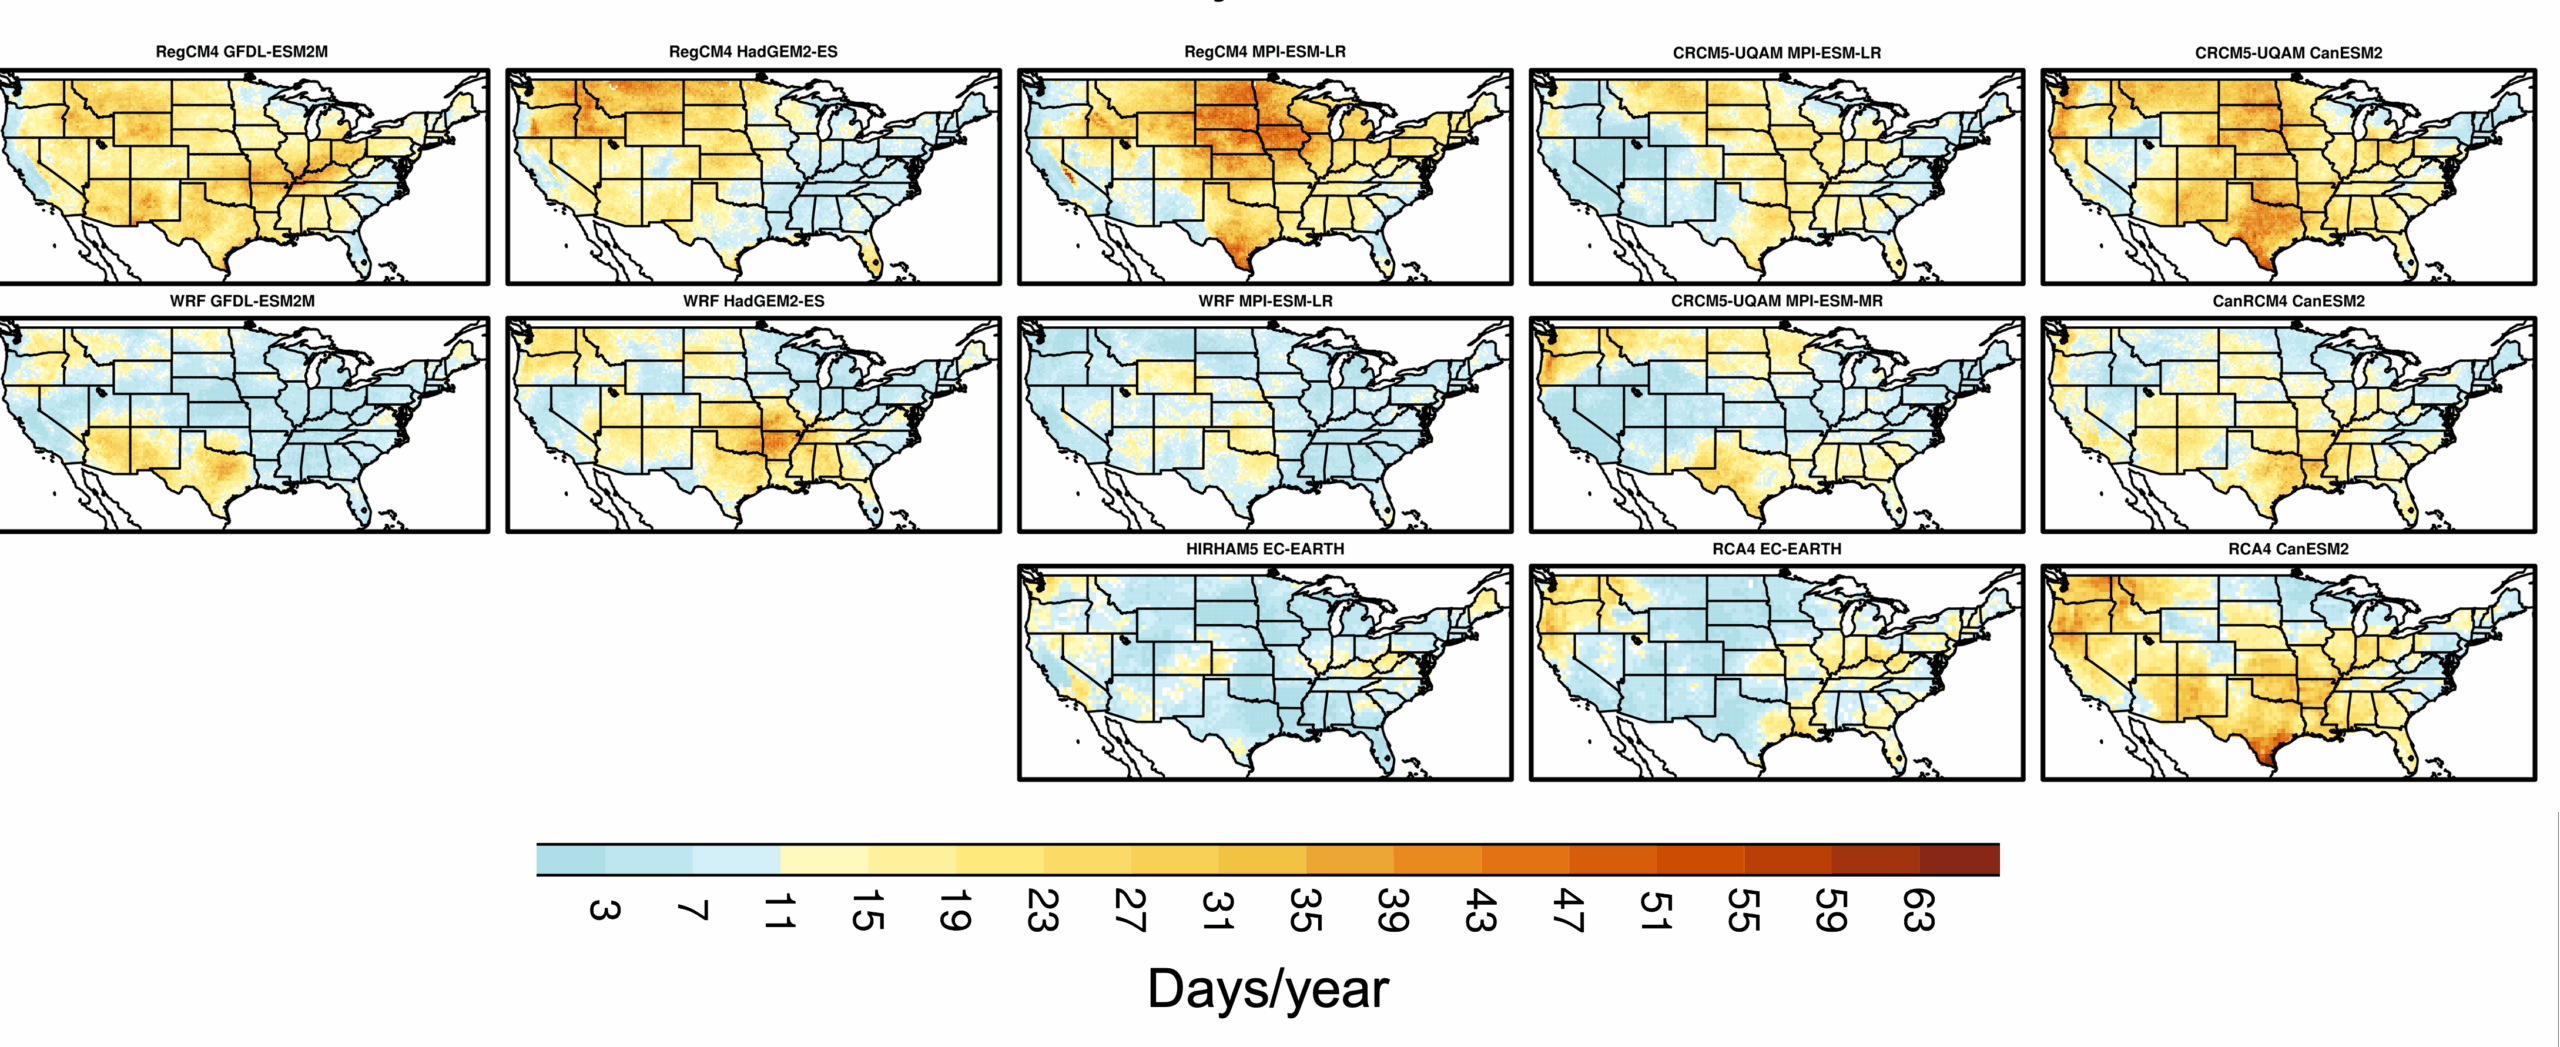
Projected change in days with extreme fire weather between 1980-2010 to 2040-2070. The projected number of days with expected extreme fire weather for 2040-2070. The number of days with extreme fire weather is defined as the median number of days per year that the fire index ‘energy release component’ (ERC) exceeds the 97th percentile of the ERC distribution in the reference period 1980-2010, calculated specifically for each gridcell. This shows an ensemble of 13 regional climate model simulations, labeled with the regional climate model and the global climate model that drove the regional simulation. Warm colors indicate an increase in the number of extreme fire weather days, while cool colors indicate a decrease in the number of extreme fire weather days, as shown in the color bar below the map. Note that 3% of 365 is approximately 11, so a value of 11 days corresponds to no change in fire weather extreme days. The data shown come from the NA-CORDEX data archive. This visualization was made as part of NSF Growing Convergence Project 2019762.

2040-2070 Median Annual Days with Above Historical 97th Percentile ERC
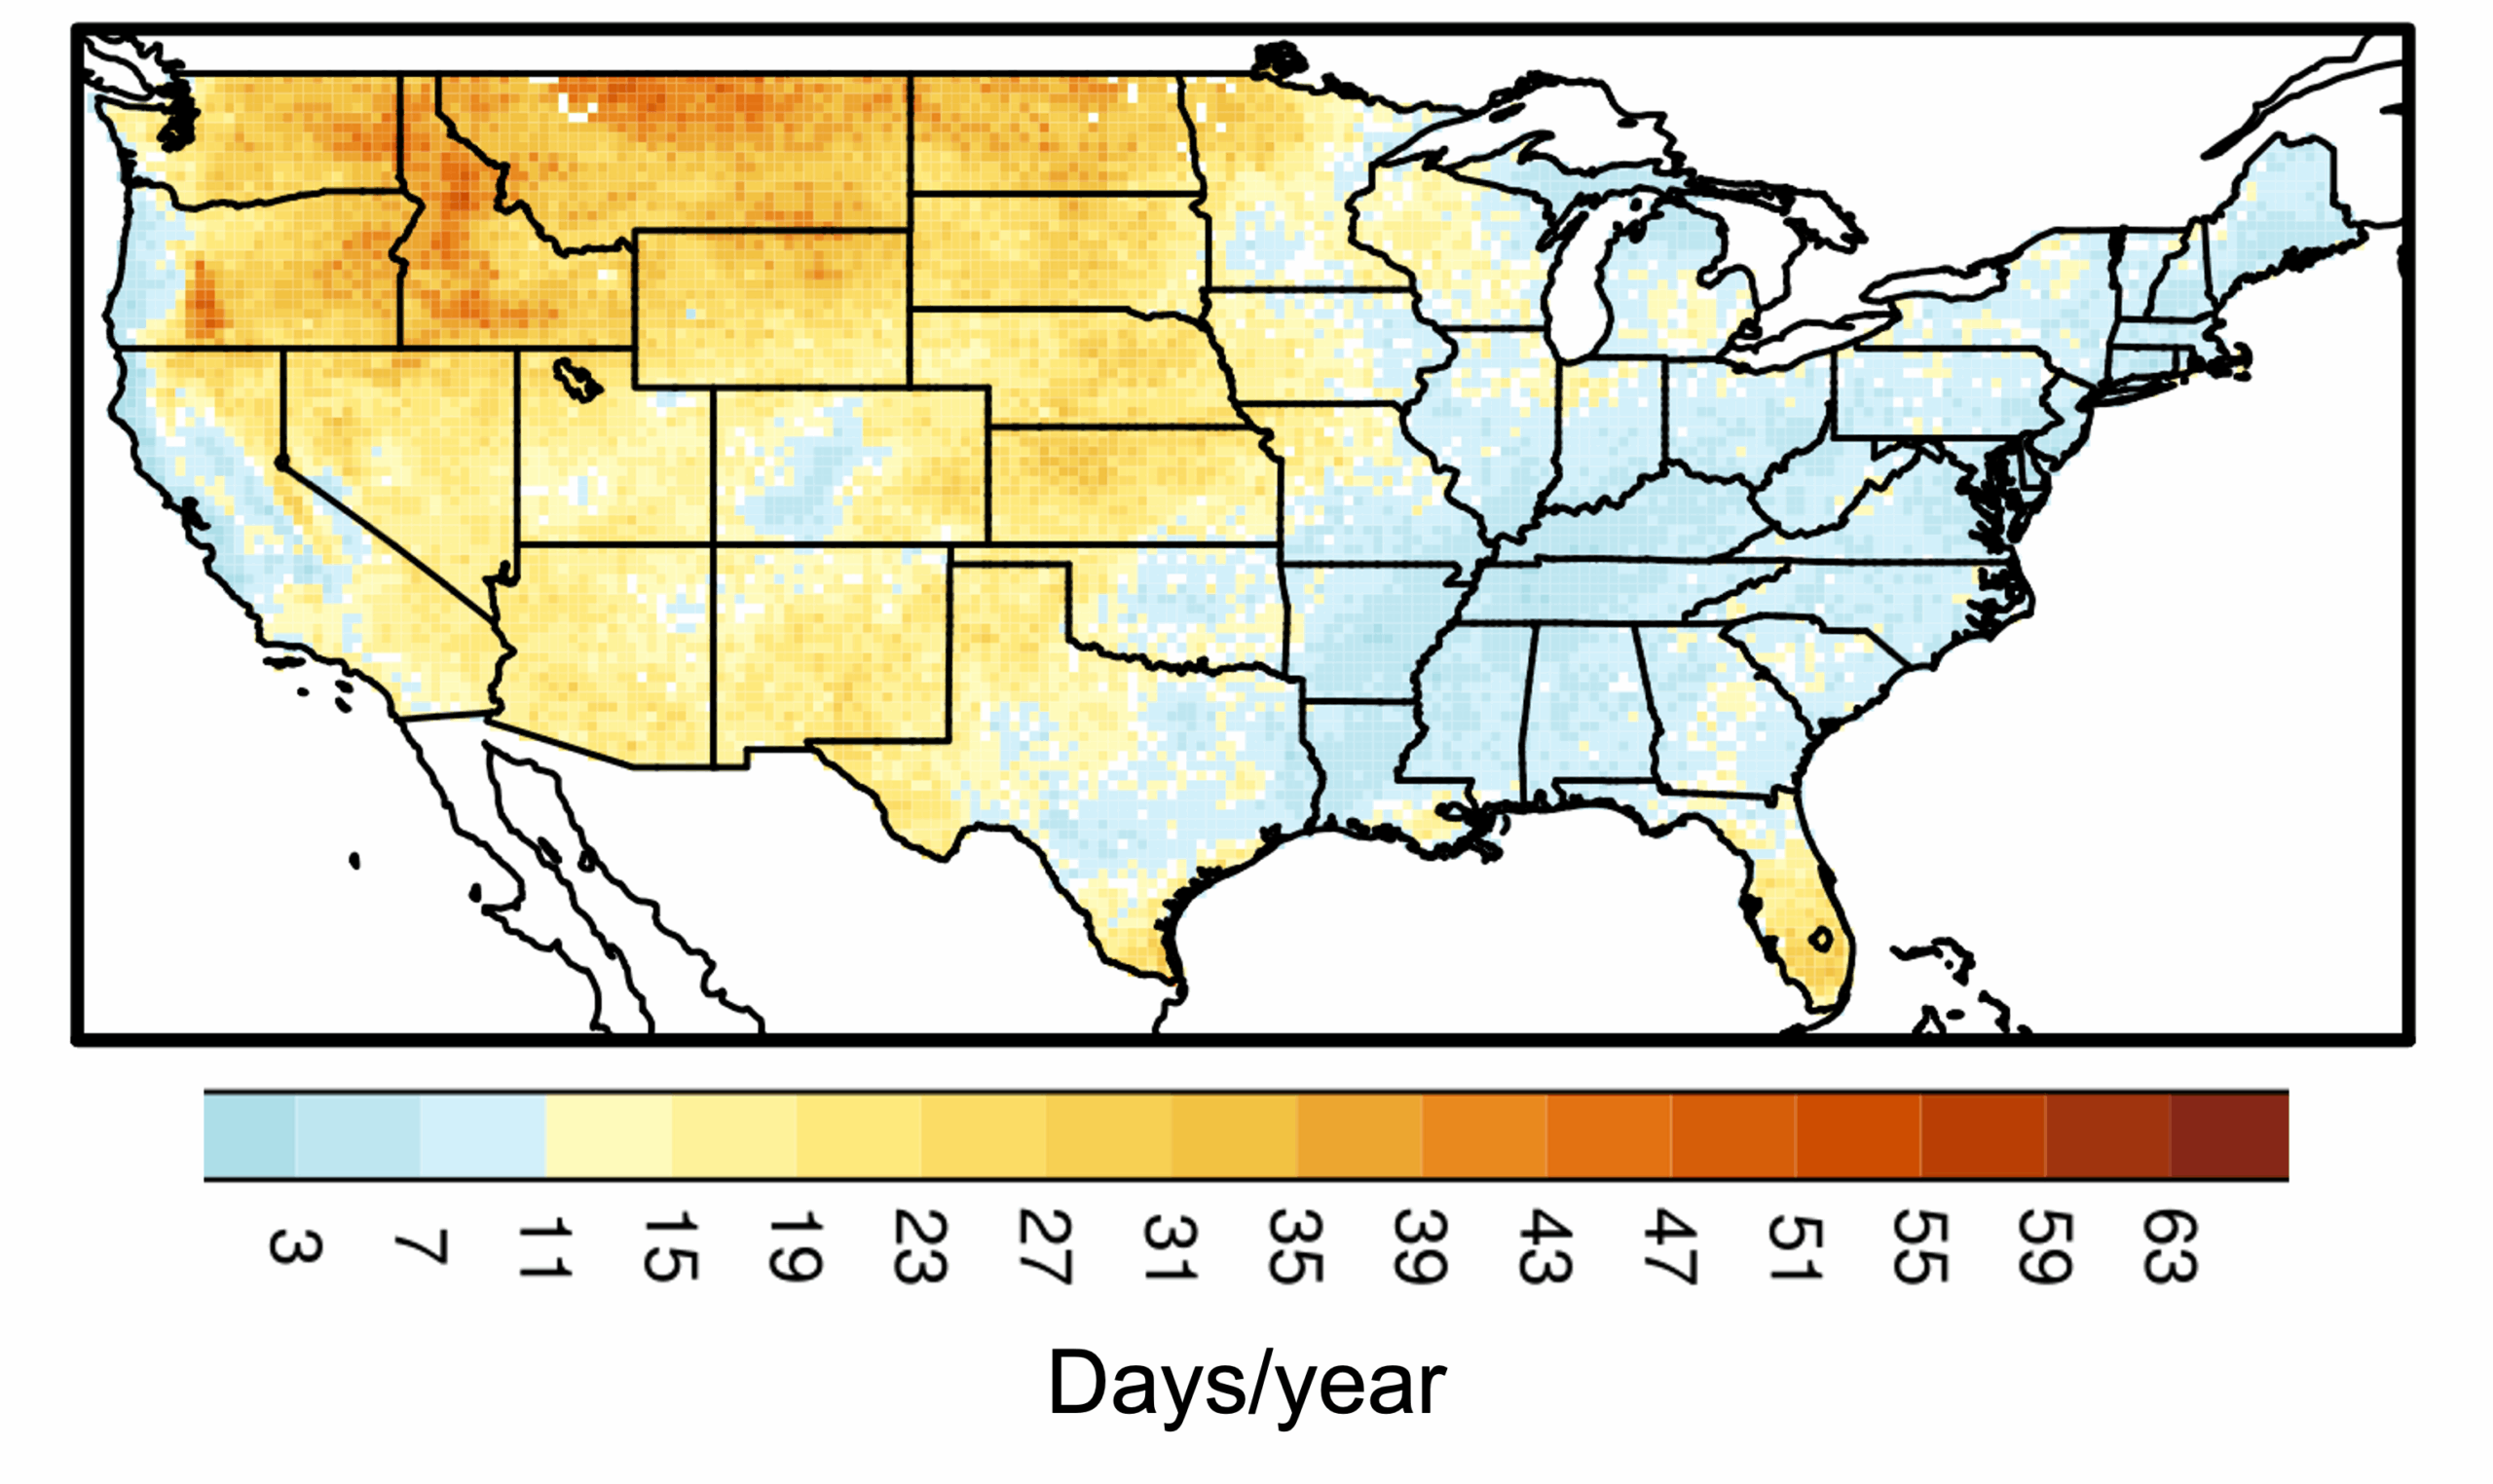
Projected number of days with extreme fire weather for 2040-2070. The number of days with expected extreme fire weather is defined as the median number of days per year that the fire index energy release component (ERC) exceeds the 97th percentile of the ERC distribution for the reference period of 1980-2010, calculated specifically for each gridcell. This shows a single simulation, the RegCM4 regional climate model, driven by the HadGEM2-ES global climate model. Warm colors indicate an increase in the number of extreme fire weather days, while cool colors indicate a decrease in the number of extreme fire weather days, as shown in the color bar below the map. Note that 3% of 365 is approximately 11, so a value of 11 days corresponds to no change in fire weather extreme days. The data shown come from the NA-CORDEX data archive. This visualization was made as part of NSF Growing Convergence Project 2019762.

Change in Fire Season Start and End Date based on Climate Model Projection of ERC
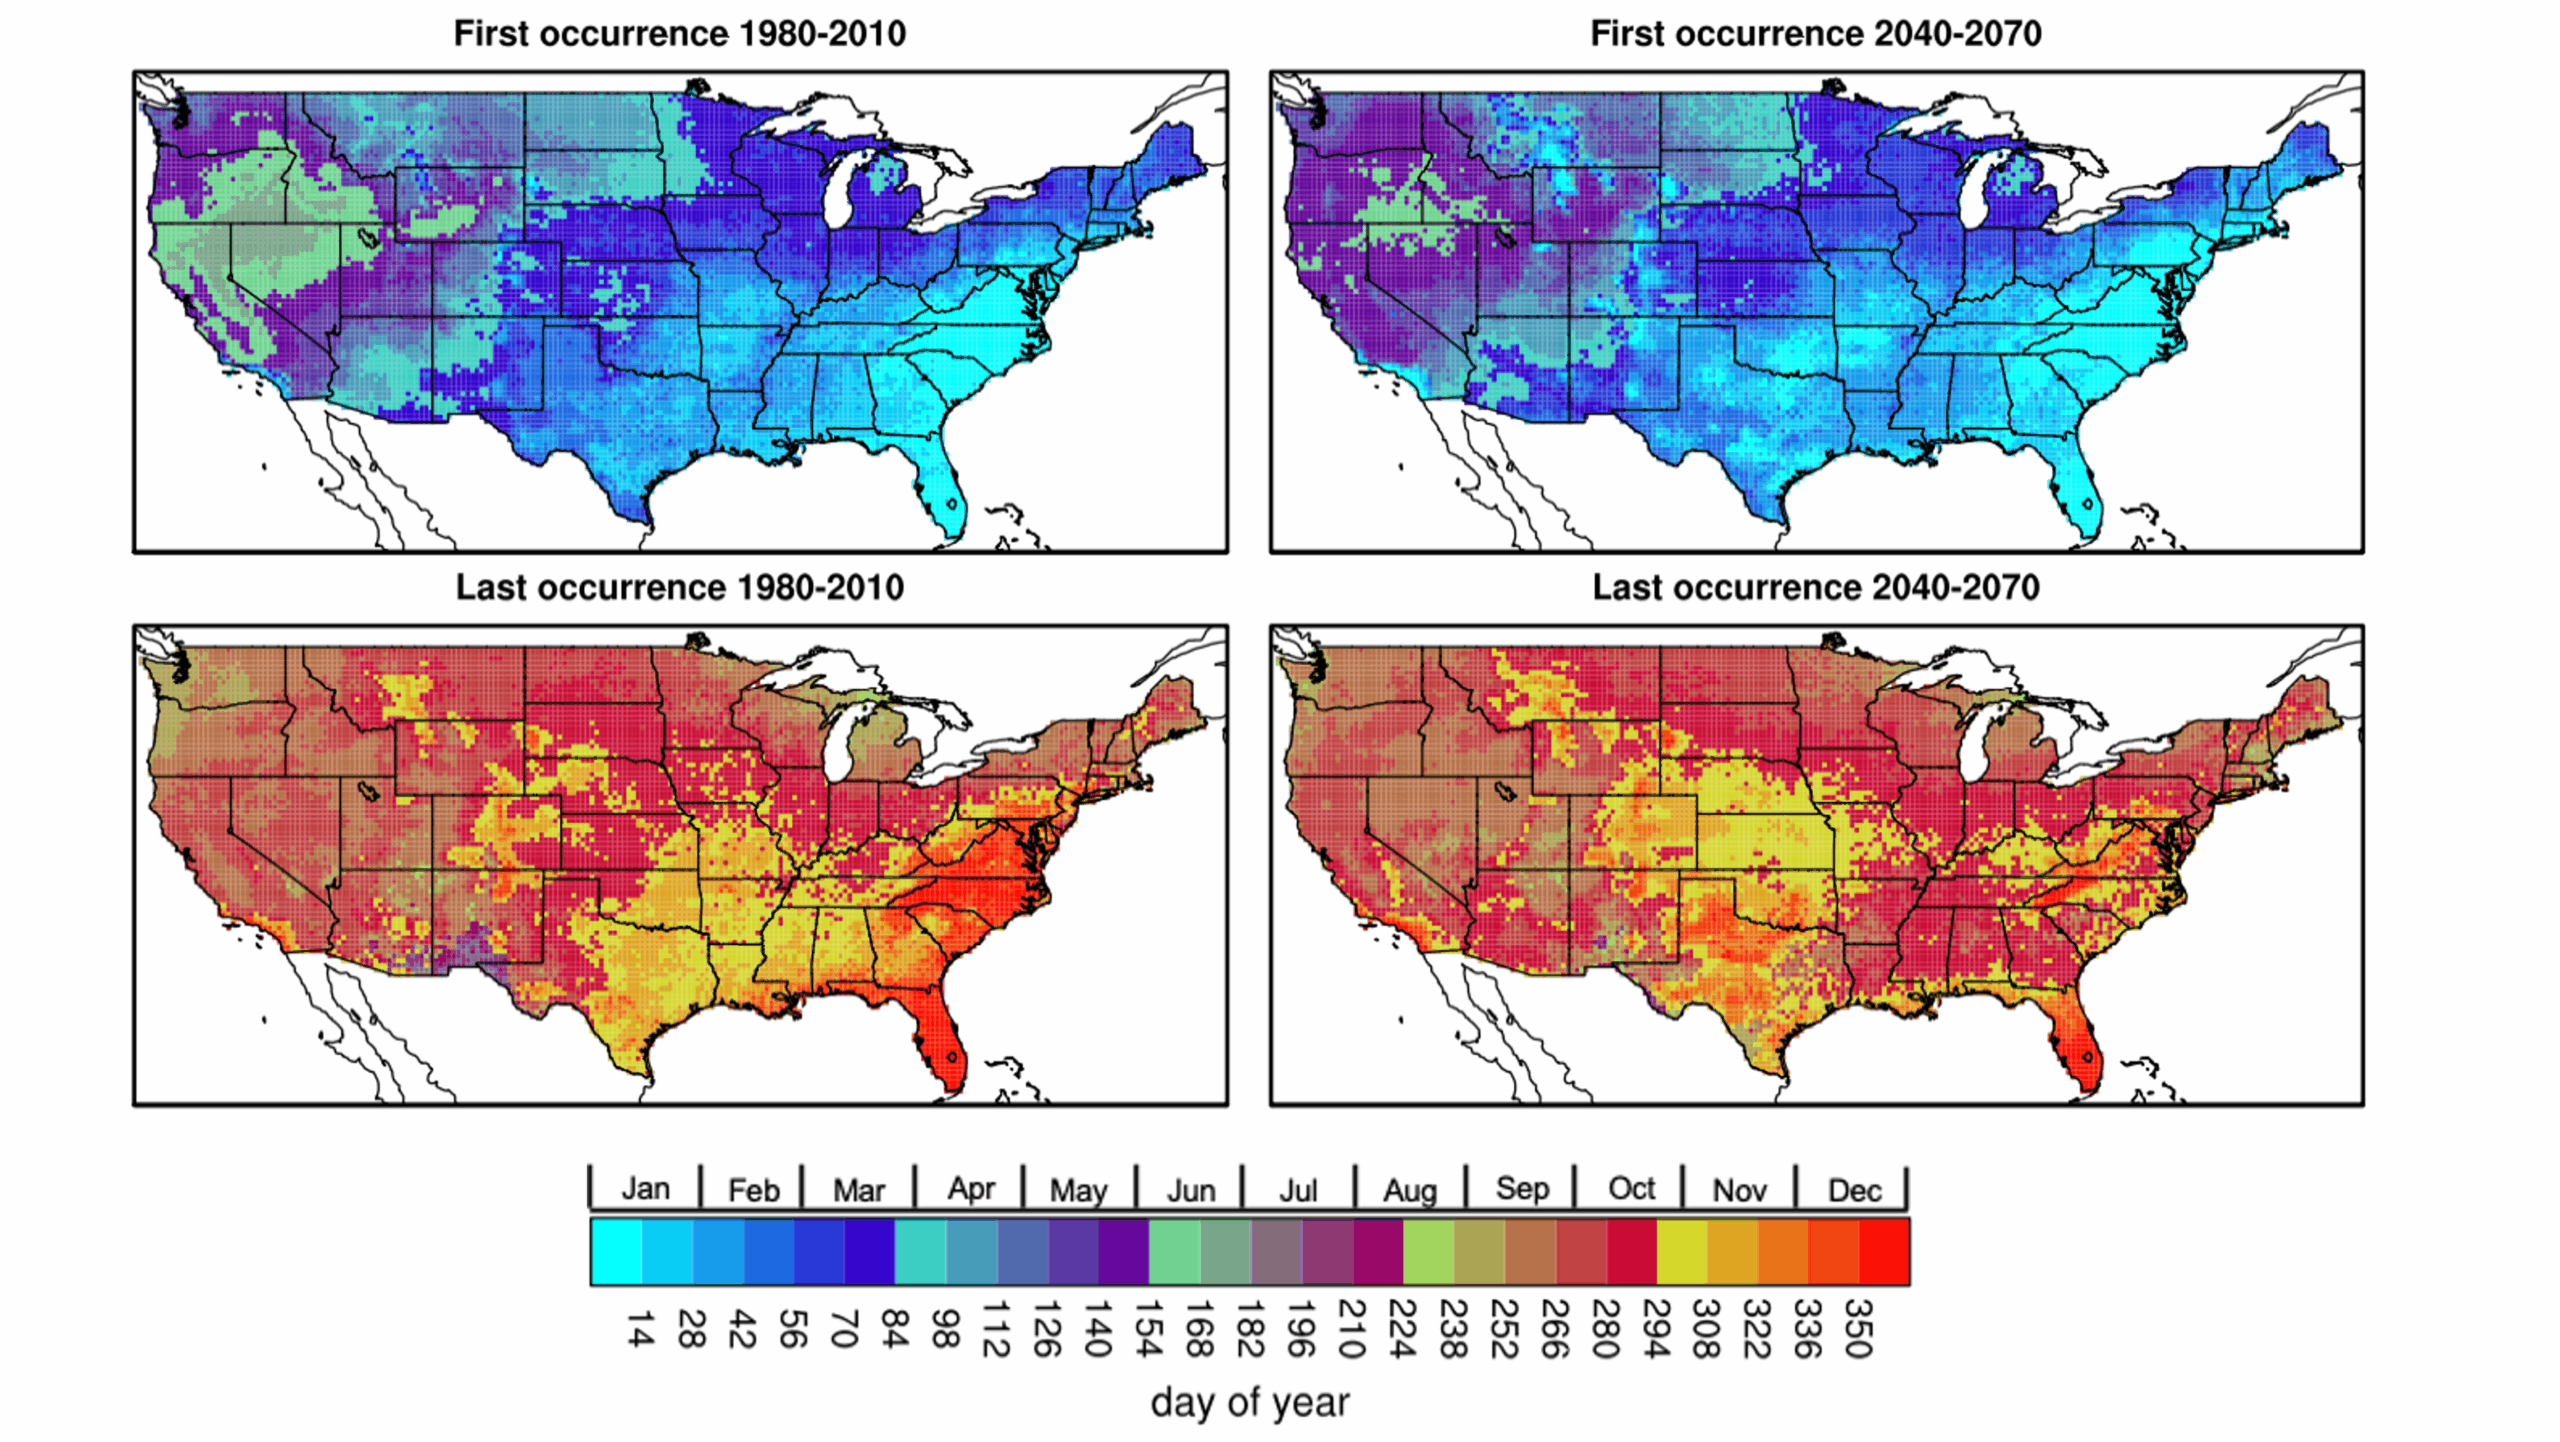
Projected change in the beginning and end of fire season across the continental United States. Fire season is defined as the period between the first and last day of exceedance of the historical 80th percentile of the fire index Energy Release Component calculated with fuel model G (ERC-G) on a 25-km grid. The top row of maps shows times of fire season start, or first exceedance of the 80th percentile ERC-G, while the bottom row shows times of fire season end, or last exceedance of the 80th percentile ERC-G. Colors on the map represent the time of the year when start and end occur. Much of the western US sees the season start shifting from June to May and the season end shifting closer to November. This visualization is only applicable in the western US, because in the Eastern and Southern Geographic Area Coordination Centers (GACCs) there is not a single concentrated fire season (“season” starts/ends in the first/last few weeks of the year). This data is for a single simulation, the RegCM4 regional climate model driven by the HadGEM2-ES global climate model, from the NA-CORDEX data archive. Note that this is a single model that is part of a larger ensemble, and should not be solely relied upon. This visualization was made as part of NSF Growing Convergence Project 2019762.

Projected Fire Danger East Troublesome Fire (CO) comparing 1970-2000 and 2040-2070
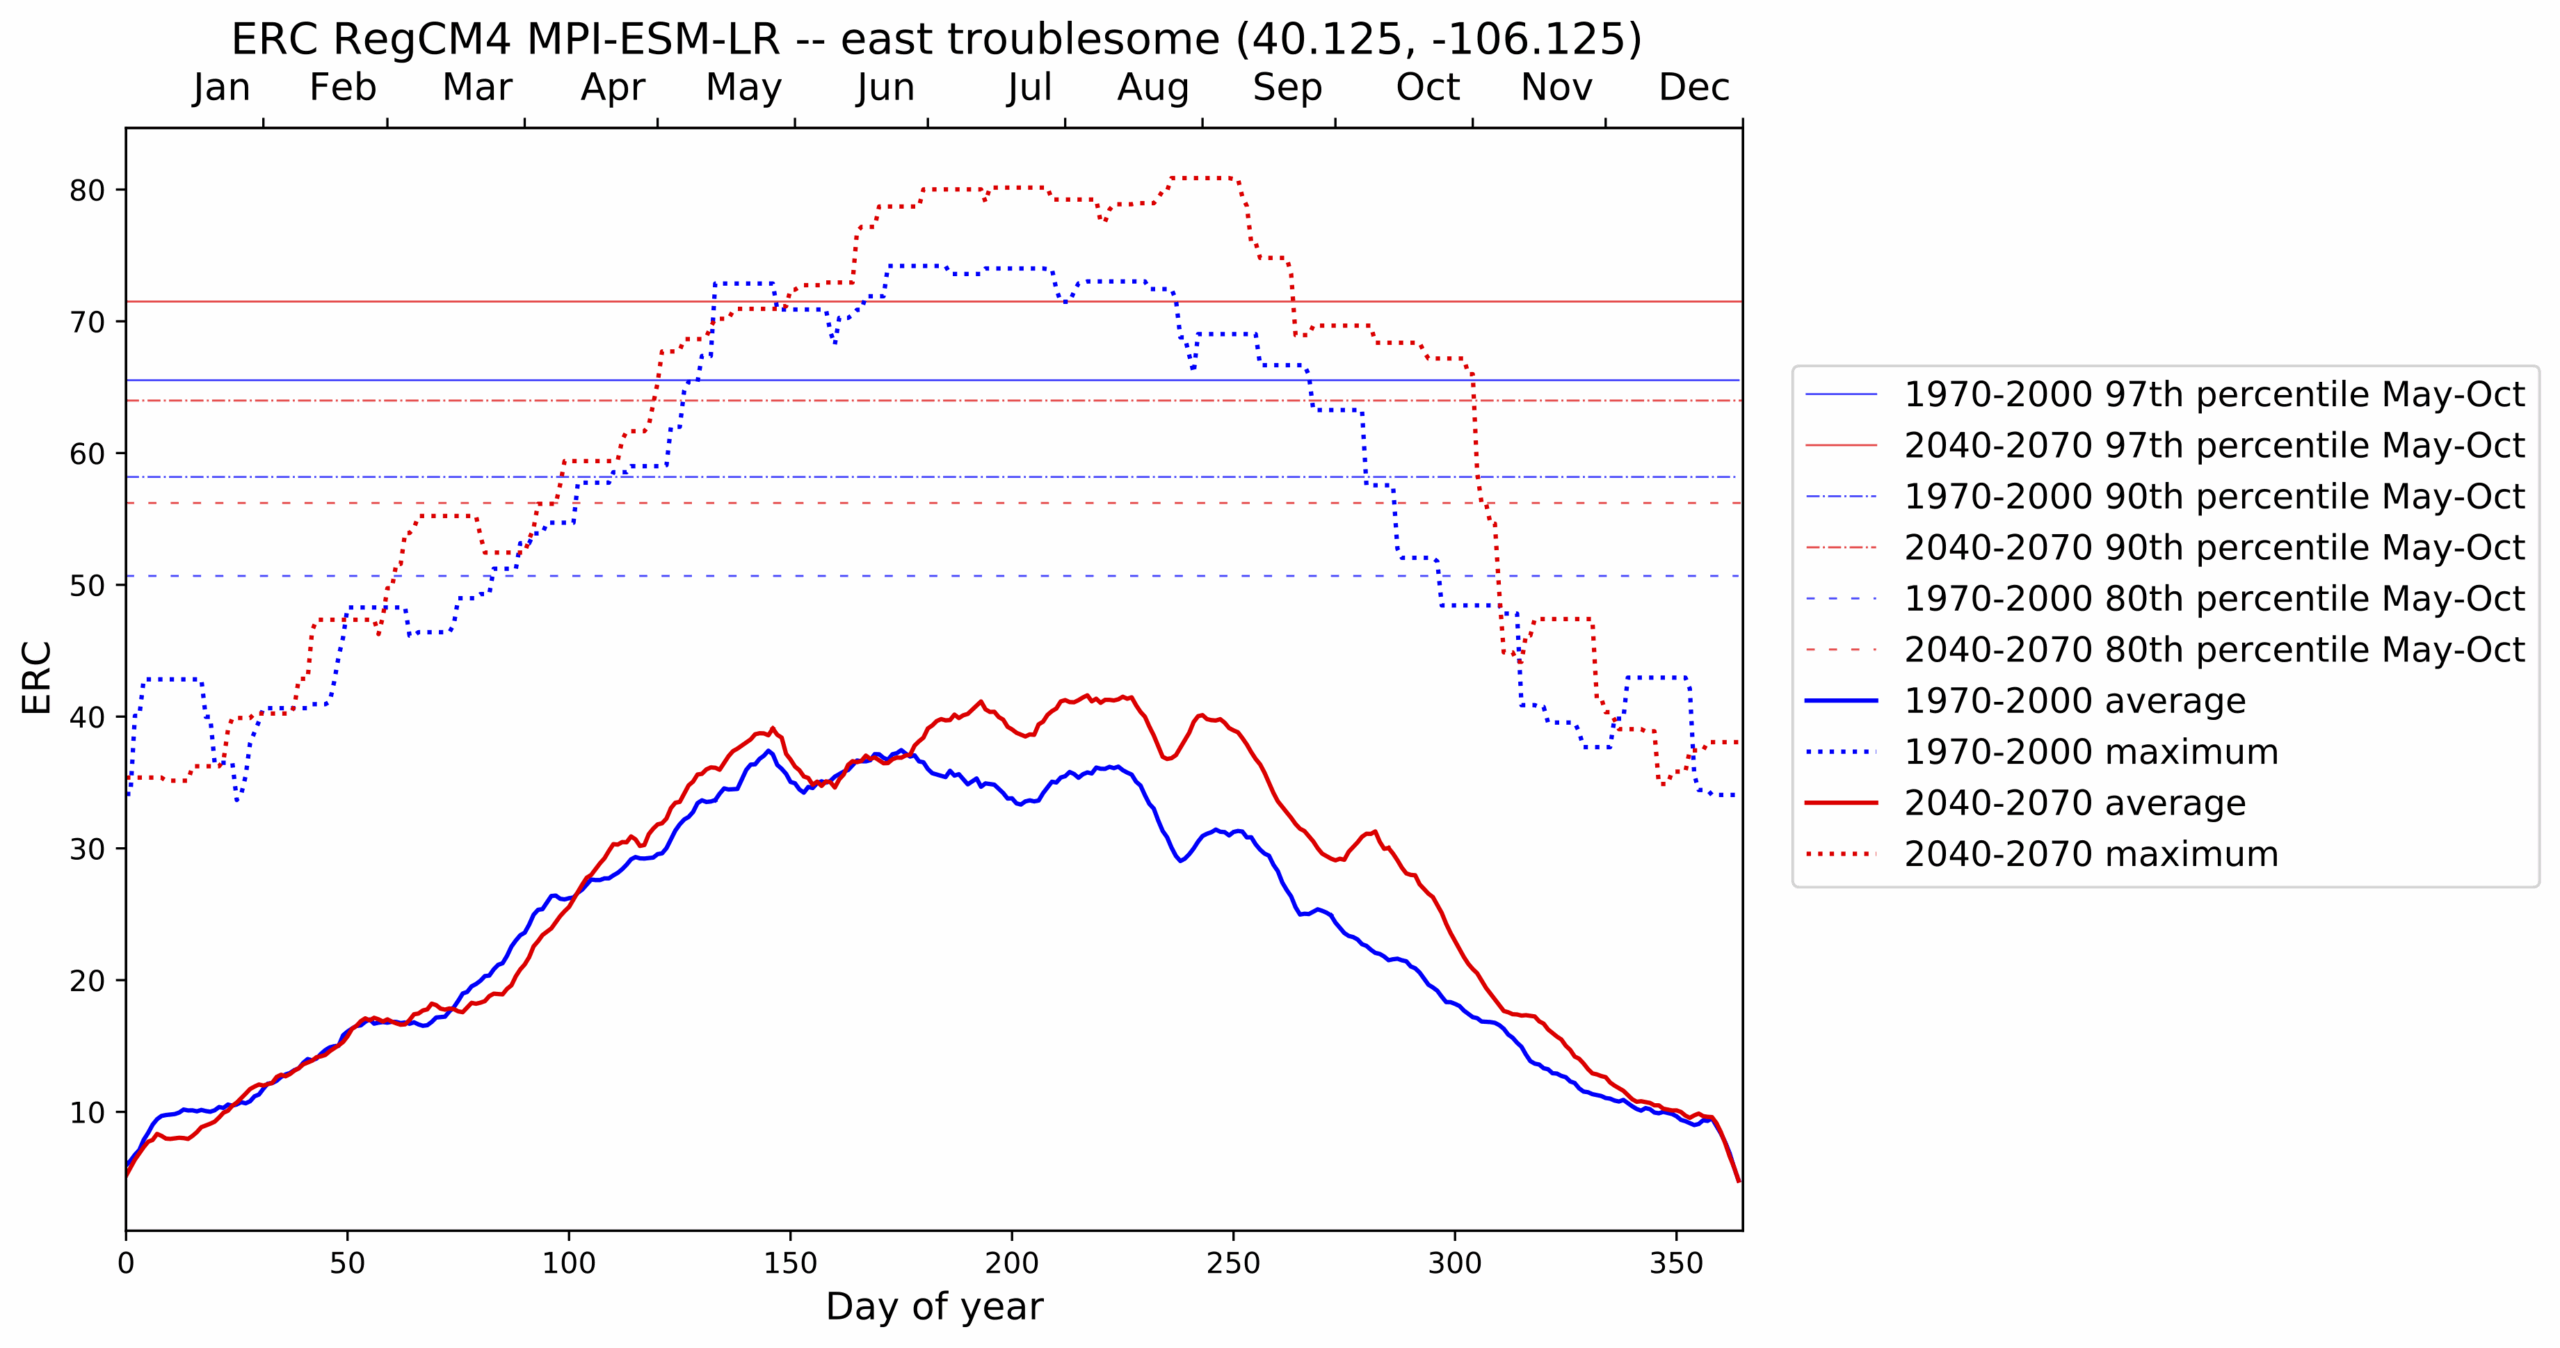
Projected fire danger for the location of the East Troublesome Fire west of Fort Collins and Boulder, CO. Various fire season (defined here as May-Oct) percentile thresholds, average, and maximum fire index values for the energy release component (ERC) are displayed from the regional climate model (RCM) RegCM4 which is driven by the global climate model (GCM) MPI-ESM-LR. These ERC values are for a single grid cell in the regional climate model that encompasses the ignition site of the 200,000-acre area burned in the East Troublesome Fire. The projections of past percentiles, average, and maximum are in blue, while projections of future percentiles, average, and maximum are in red. The pocket card compares the reference period (1970-2000) to a midcentury period (2040-2070) to show projected changes by midcentury for this particular model at this location. The data shown comes from NA-CORDEX. Note that this is a single model that is part of a larger ensemble, and should not be solely relied upon. This visualization is included in the paper Cullen et al. “Growing convergence research for proactive risk management through co-produced climate and wildfire simultaneity decision support which is currently submitted to Risk Analysis. This visualization was made as part of NSF Growing Convergence Project 2019762.

Change in Fire Season Start and End Date based on Climate Model Projection of ERC
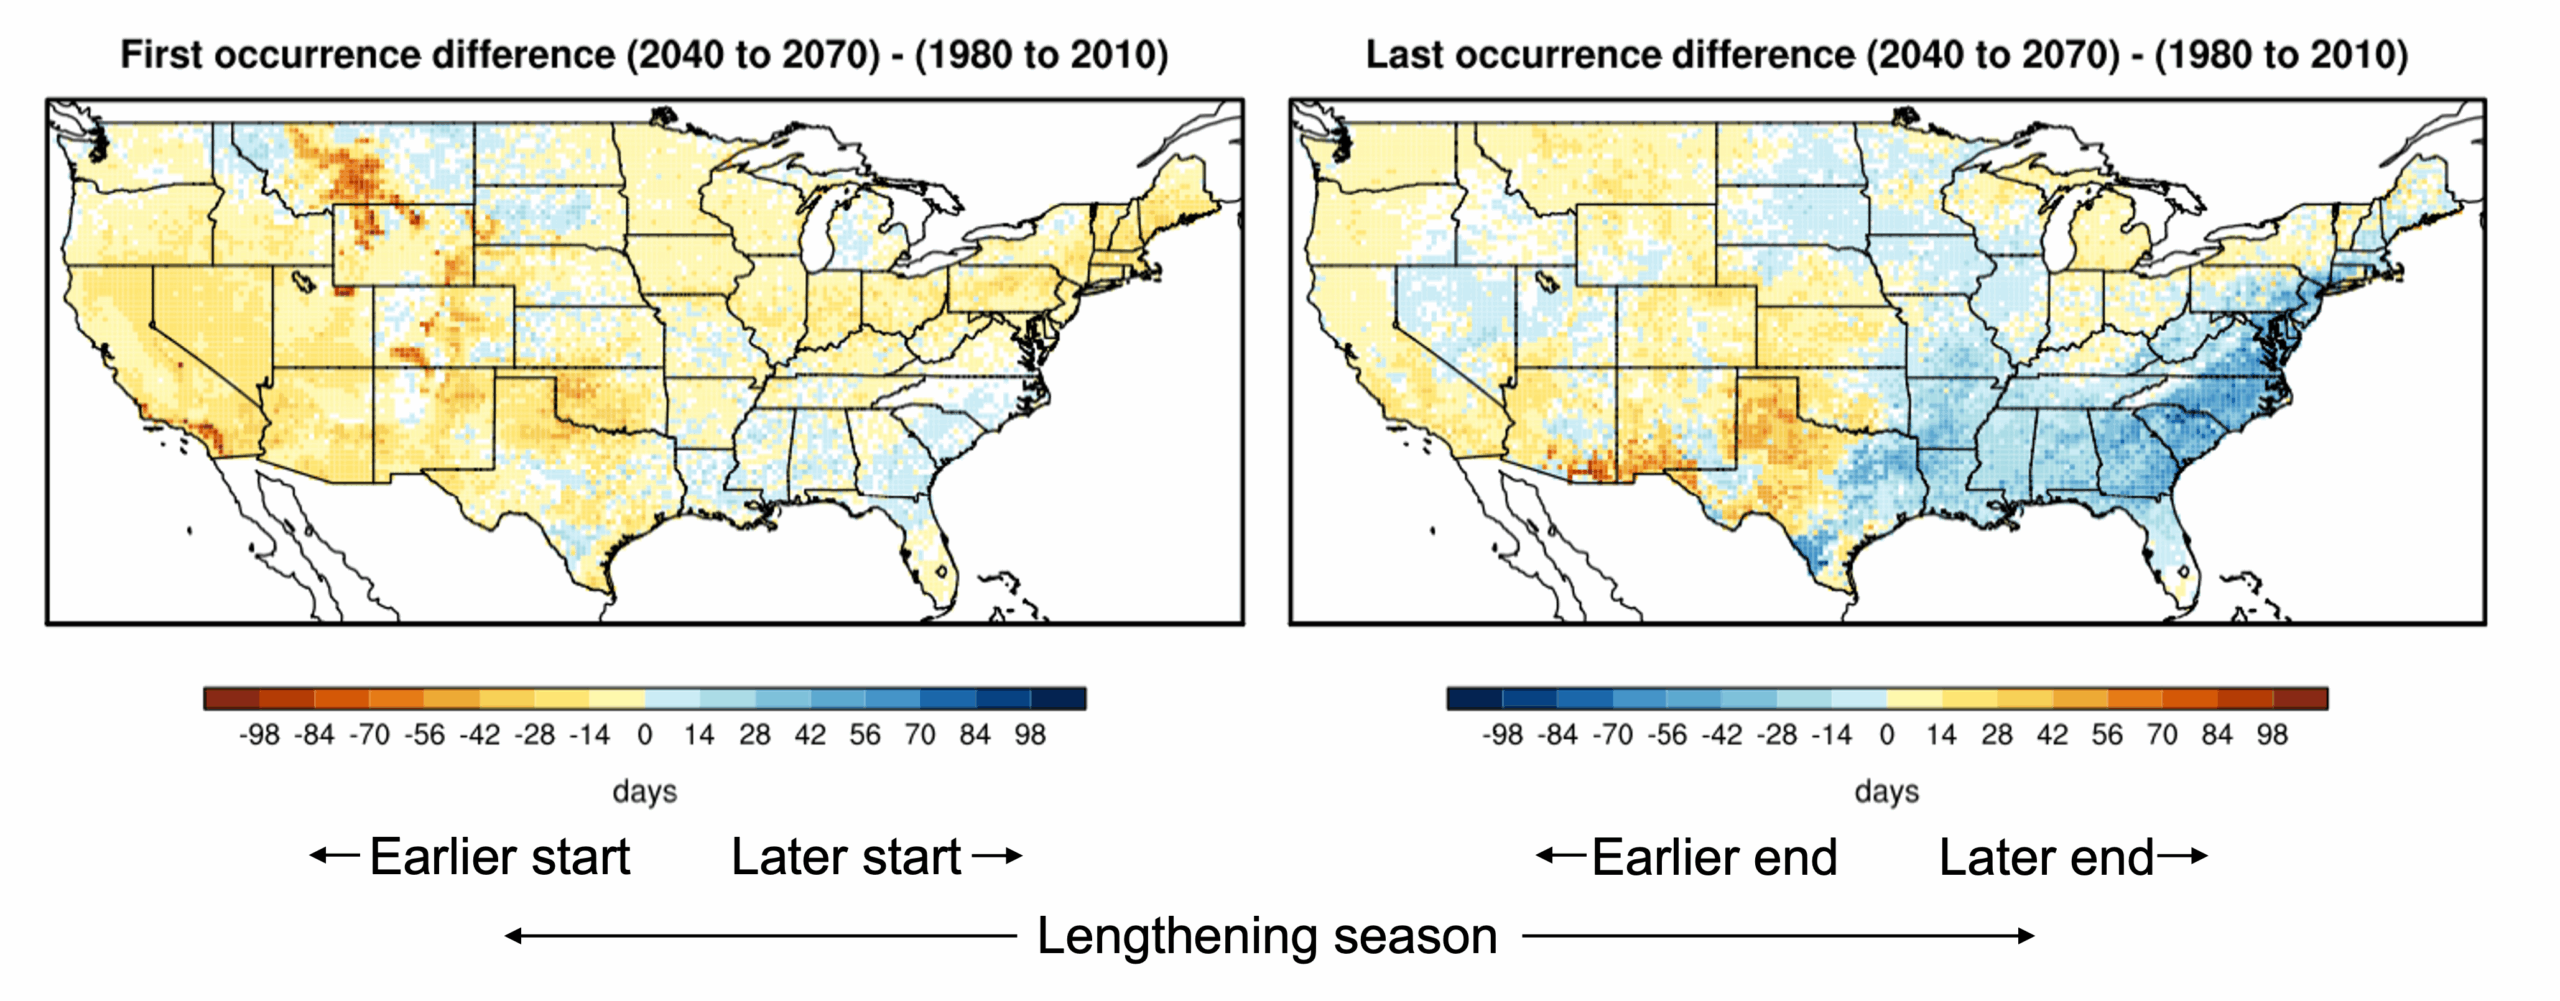
Projected change in the beginning and end of fire season across the continental United States. Fire season is defined as the first day to last day of projected exceedance of the historical 80th percentile value of the fire index Energy Release Component (ERC) in each grid cell area. The left map shows changes in fire season start, or the first occurrence of 80th percentile ERC; the right shows changes in fire season end, or last occurrence of 80th percentile ERC. In this projection, much of the West sees fire season starting 2-4 weeks earlier, and in Montana the start is 2 months earlier. The Southwest region fire season ends later by over a month. California’s fire season ends later by 2-4 weeks. This visualization is only applicable to the western US, because in the Eastern and Southern Geographic Area Coordination Centers (GACCs) there is not a single concentrated fire season (“season” starts/ends in the first/last few weeks of the year). This data is for a single simulation, the RegCM4 regional climate model driven by the HadGEM2-ES global climate model, from the NA-CORDEX data archive. Note that this is a single model that is part of a larger ensemble, and should not be solely relied upon. This visualization was made as part of NSF Growing Convergence Project 2019762.

Projected Fire Danger (ERC-Ensemble) Creek Fire (CA) comparing 1980-2010 and 2040-2070
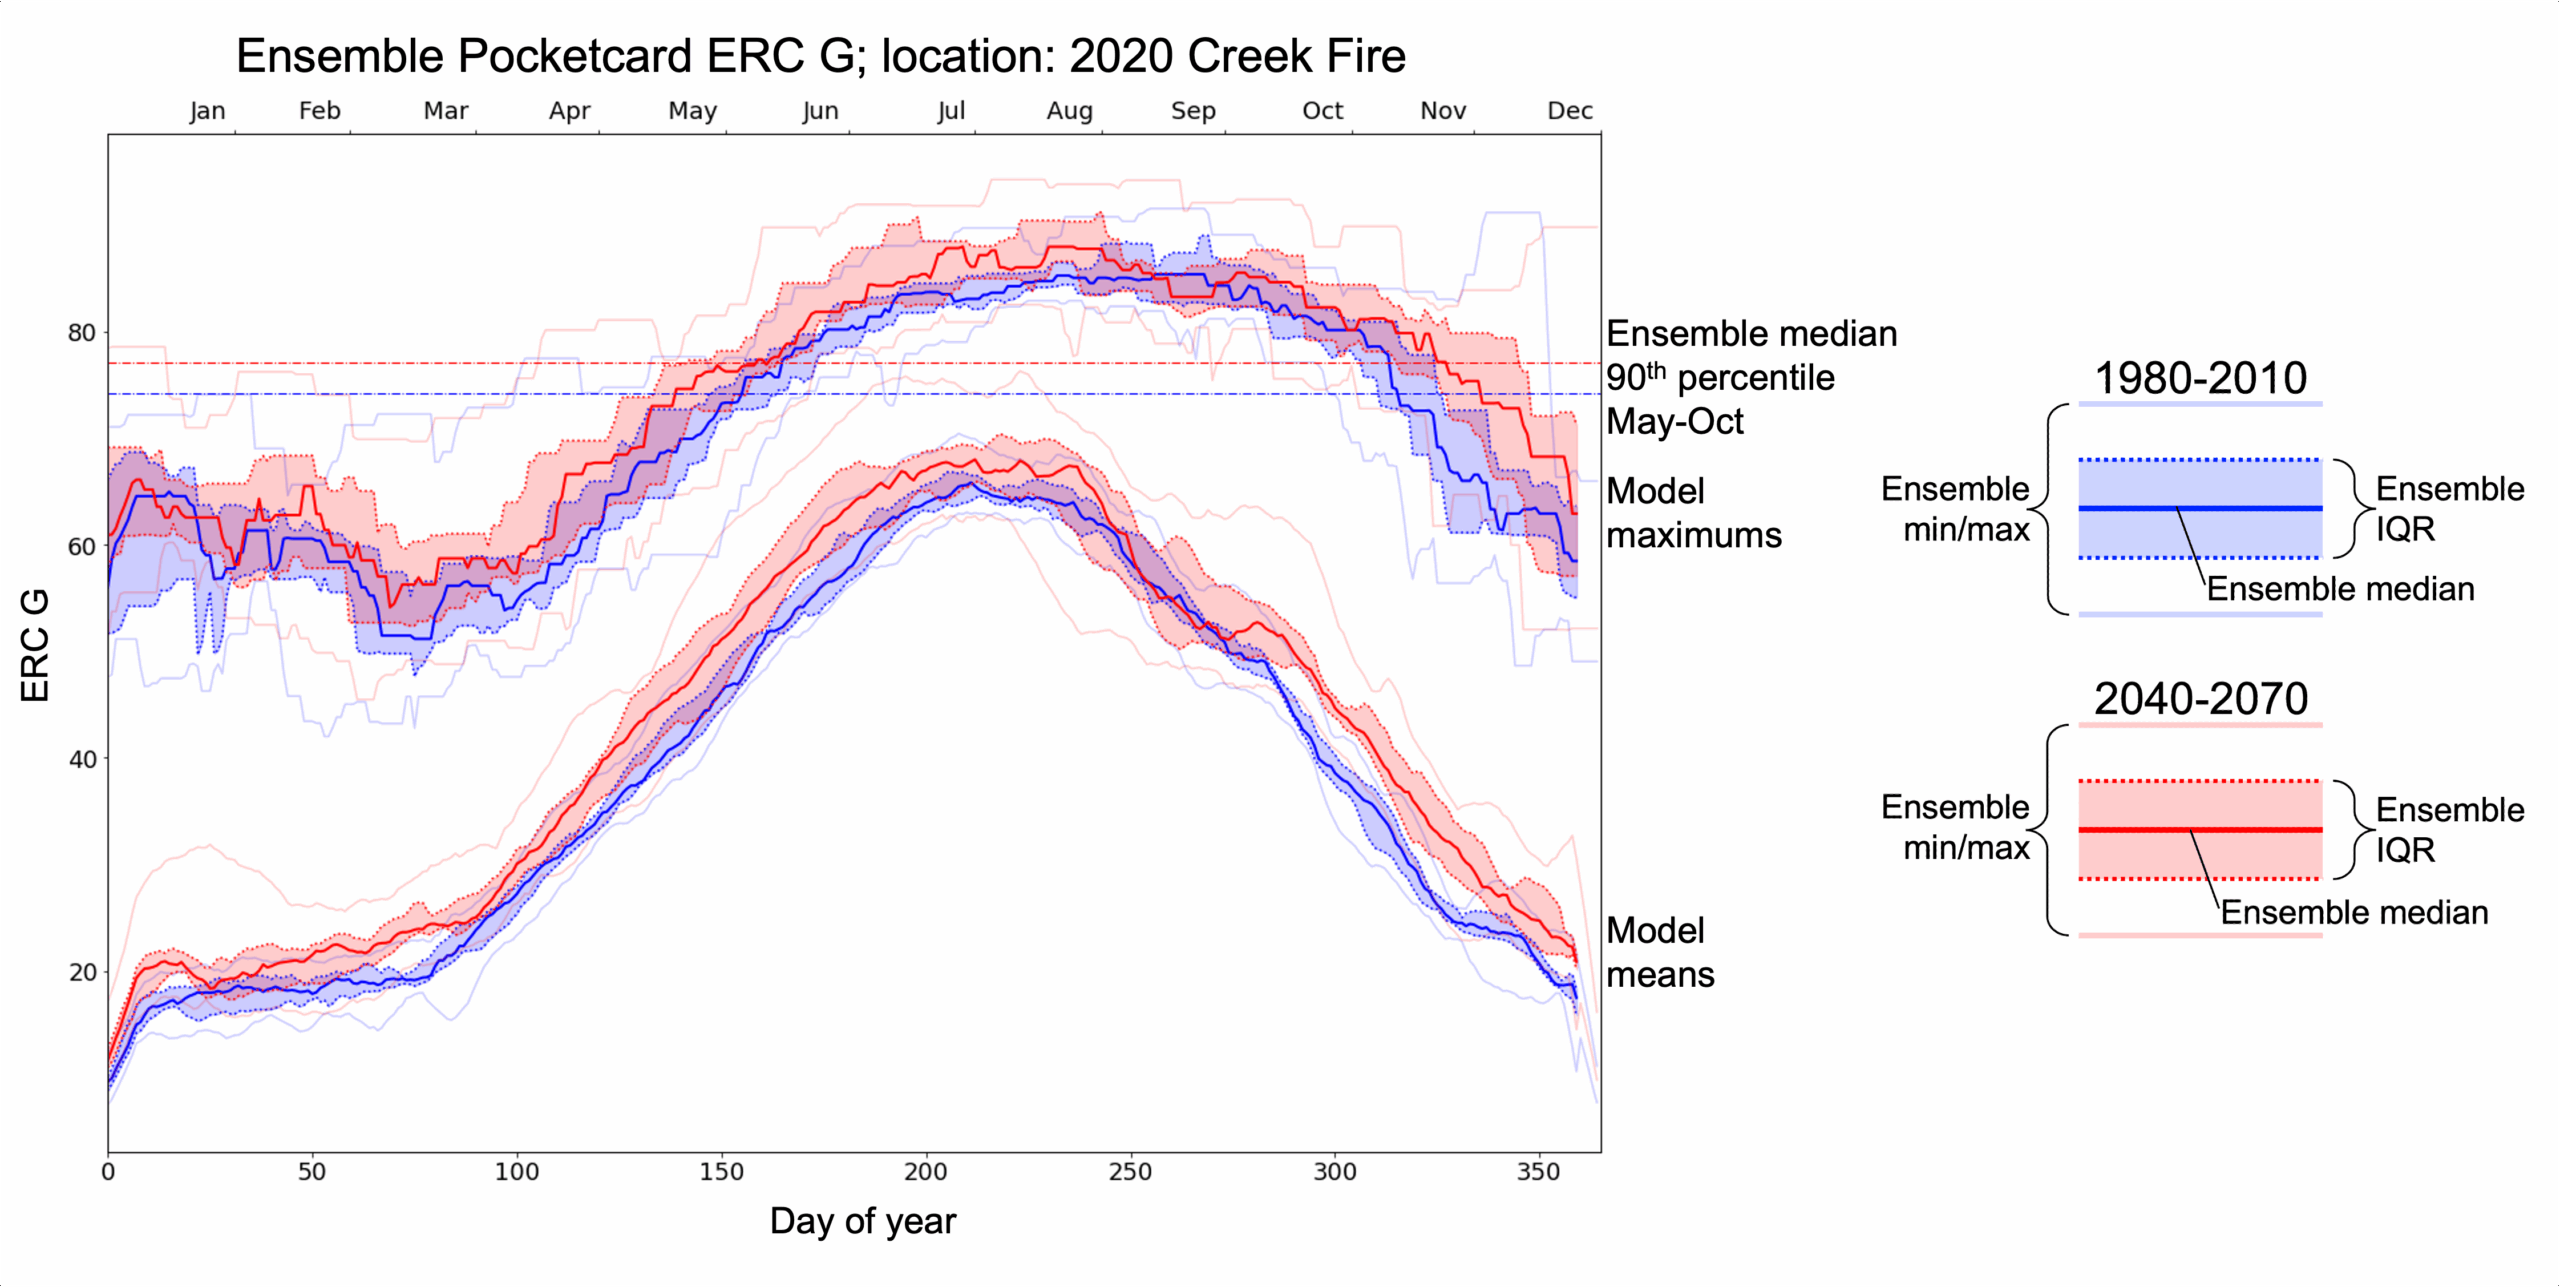
Projected fire danger for the approximate location of the 2020 Creek Fire in Northern California. The energy release component (ERC), a fire danger index, is calculated with the National Fire Danger Rating System fuel model G for a model ensemble of 13 regional climate simulations. The ensemble data for average and maximum ERC values have each been distilled down into 5 values for each day of the year: the model ensemble minimum, 25th percentile, median, 75th percentile, and maximum, which communicate the uncertainty associated with the model ensemble. The reference period (1980-2010) is shown with blue lines and blue-shaded interquartile range (IQR), while the midcentury future period (2040-2070) is shown with red lines and red-shaded IQR. The model ensemble averages of the 90th percentile of the fire season (defined here as May-October) are also shown for the reference and future periods. The data shown comes from NA-CORDEX. This visualization was made as part of NSF Growing Convergence Project 2019762.

Projected Fire Danger (ERC-Ensemble) Lionshead Fire (OR) comparing 1980-2010 and 2040-2070
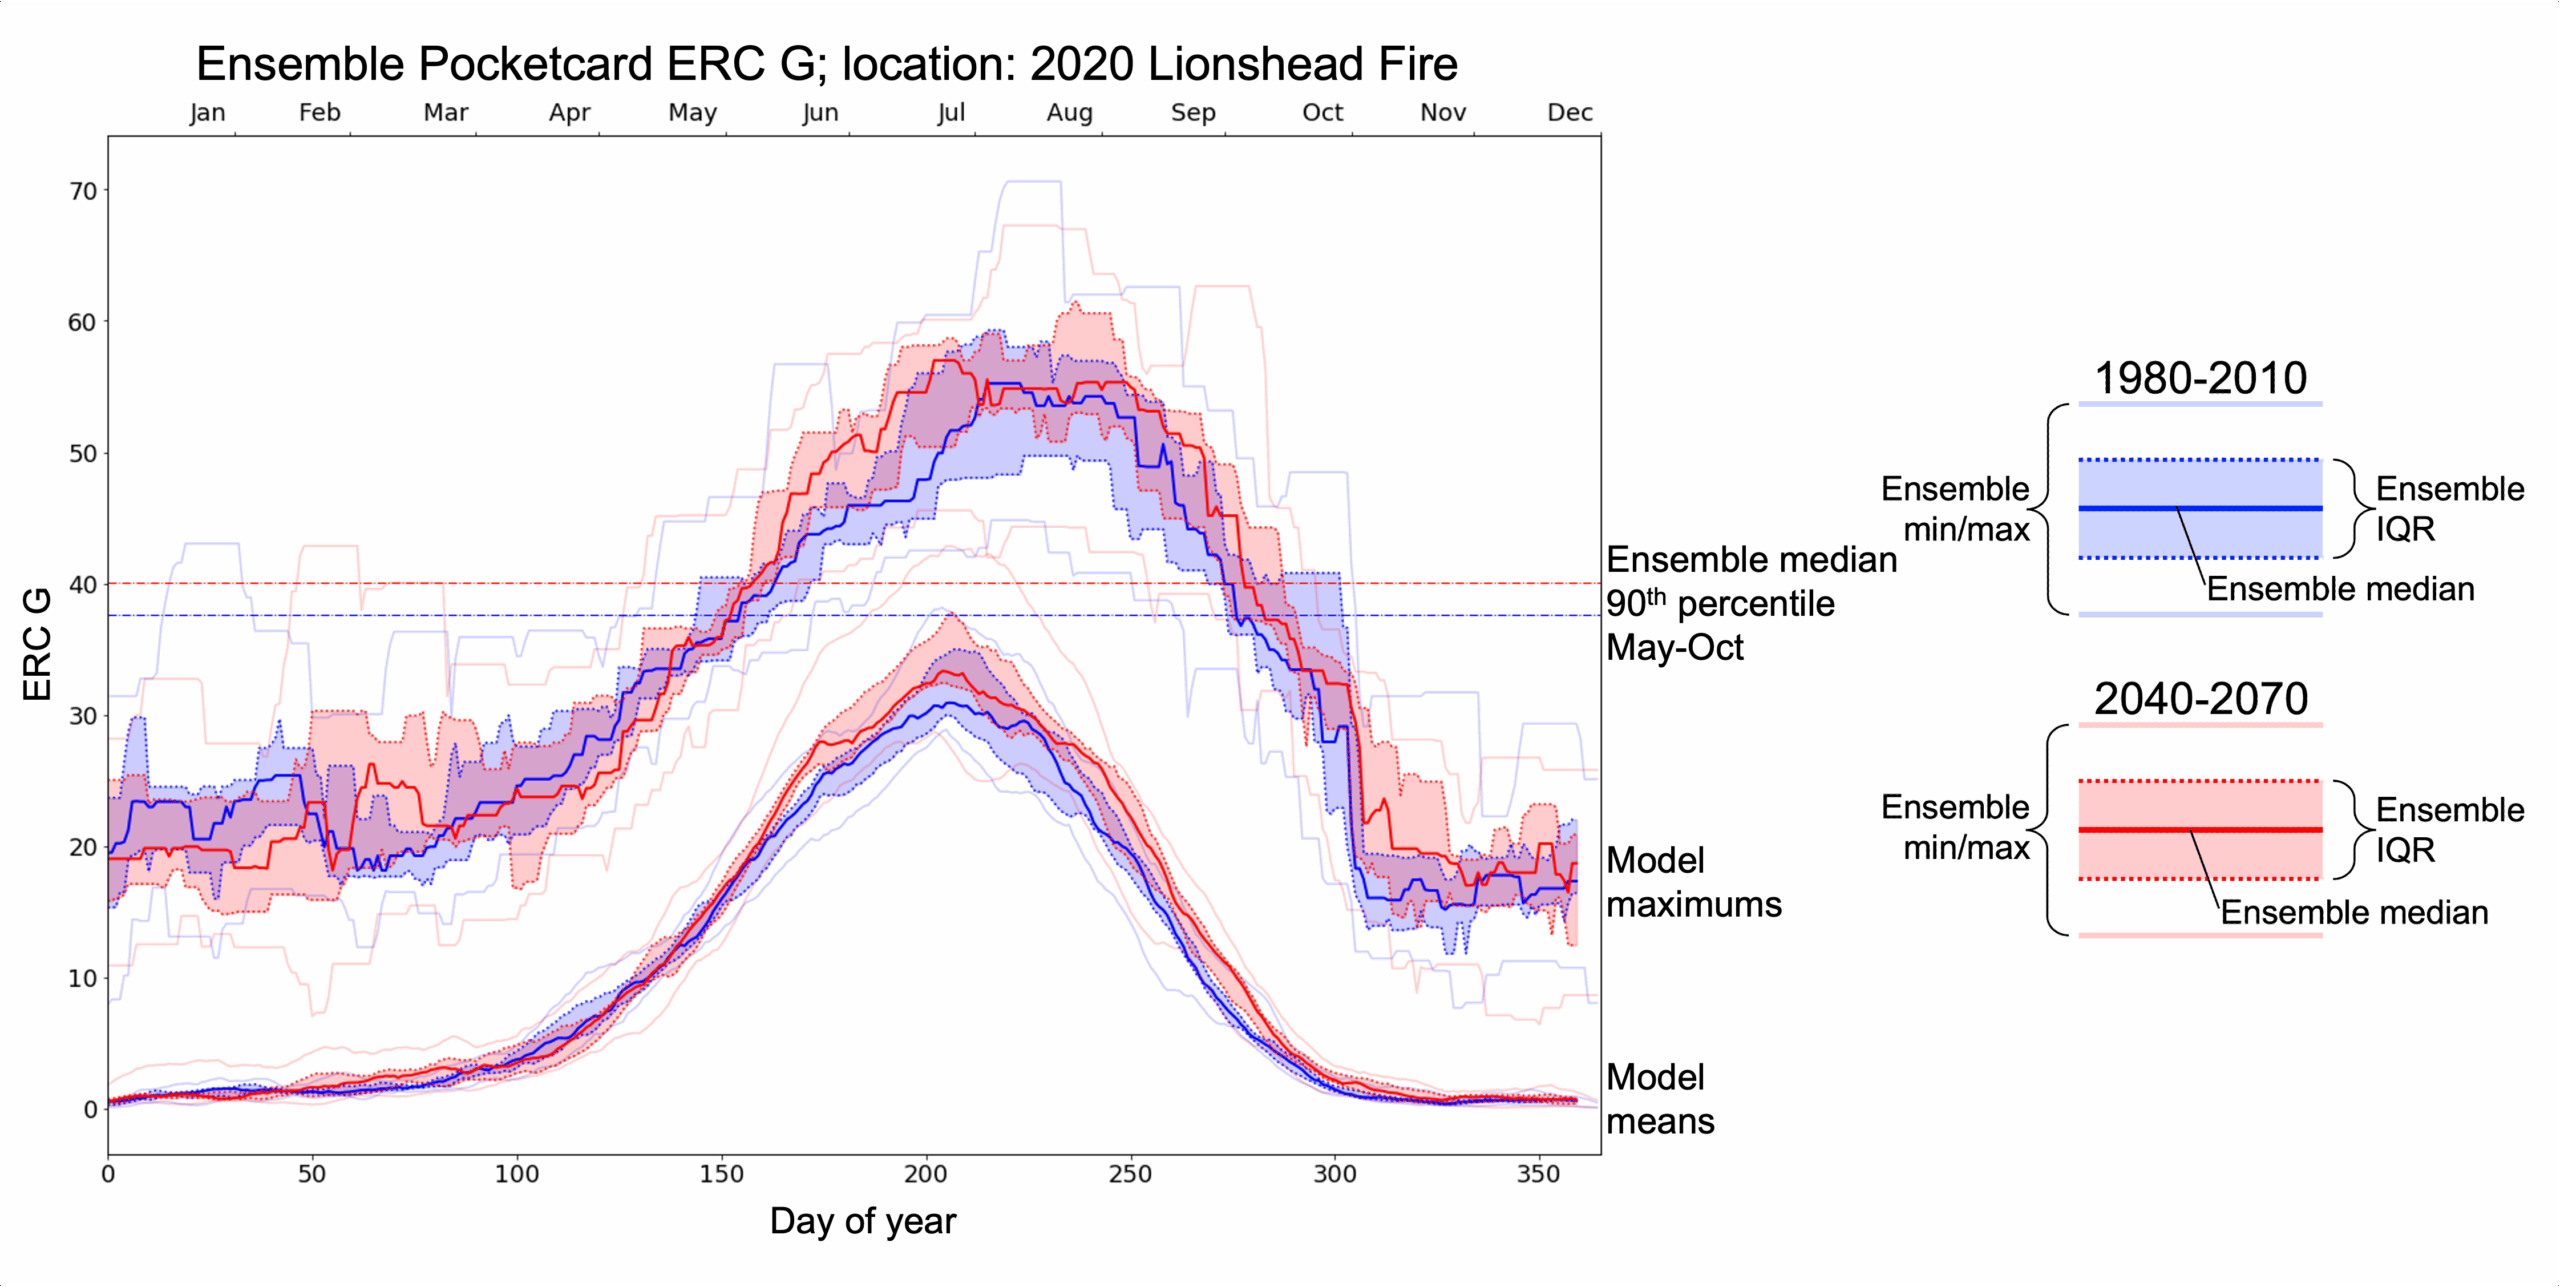
Projected fire danger for the approximate location of the 2020 Lionshead Fire in Oregon. The energy release component (ERC), a fire danger index, is calculated with the National Fire Danger Rating System fuel model G for a model ensemble of 13 regional climate simulations. The ensemble data for average and maximum ERC values have each been distilled down into 5 values for each day of the year: the model ensemble minimum, 25th percentile, median, 75th percentile, and maximum, which communicate the uncertainty associated with the model ensemble. The reference period (1980-2010) is shown with blue lines and blue-shaded interquartile range (IQR), while the midcentury future period (2040-2070) is shown with red lines and red-shaded IQR. The model ensemble averages of the 90th percentile of the fire season (defined here as May-October) are also shown for the reference and future periods. The data shown come from NA-CORDEX. This visualization was made as part of NSF Growing Convergence Project 2019762.